Bonus Content for STLE Members
Oil analysis limitations
By Dr. Nancy McGuire, Senior Feature Writer | TLT Industry Insights November 2023
Comparing lab test results can be like comparing apples to oranges unless you understand what the results are telling—and not telling—you.

Photo courtesy of Marco Verch Professional Photographer/Flickr, CC BY 2.0.
KEY CONCEPTS
•
Different lab tests measure different properties, trends and even different particle populations.
•
Various tests offer widely different levels of precision and are subject to different interferences.
•
Baseline tests, followed by regular repeat tests, provide valuable information on the condition of a system.
Meet the Presenter
This article is based on an Industry Insights presentation titled
Oil Analysis Limitations by STLE member Evan Zabawski on Jan. 17, 2023. Industry Insights is a monthly virtual event series available for free to STLE members. These events provide a forum for members to collaborate with STLE industry peers and an expert on a specific topic who gives a brief presentation, then facilitates conversation by asking discussion questions and providing actionable takeaways. For more information,
click here.
STLE member Evan Zabawski is senior technical advisor for Eurofins TestOil. He is an STLE Certified Lubrication Specialist™ (CLS), and he has diplomas in chemical engineering and 4th class power engineering. He has extensive experience in training tradespeople and professionals in a variety of fields, including lubrication fundamentals, contamination control, condition monitoring and used oil analysis. Zabawski has been an STLE member for more than 20 years, serving as chair of the Alberta Section for eight years, as an instructor of the Condition Monitoring course at STLE annual meetings and as the former editor of TLT. He served as the editor for the STLE Alberta Section’s Basic Handbook of Lubrication, Third Edition. He also contributed as one of the editors for STLE/CRC’s Handbook of Lubrication and Tribology, Volume II: Theory and Design, Second Edition. You can reach Zabawski at
Evan.Zabawski@et.eurofinsus.com.
 Evan Zabawski
When it comes to running oil analyses, more isn’t necessarily better, says Evan Zabawski. Efficient, effective testing requires knowing which tests correlate under a given set of conditions and understanding how the results support—or don’t support—each other.
Oil tests fall into three general categories: fluid properties, wear debris analysis and contaminant determination (see Figure 1). Not surprisingly, test results from different categories don’t tend to correlate with each other. However, even different tests from the same category don’t always produce results that correlate with each other, making it essential to understand what each type of test does and doesn’t measure.
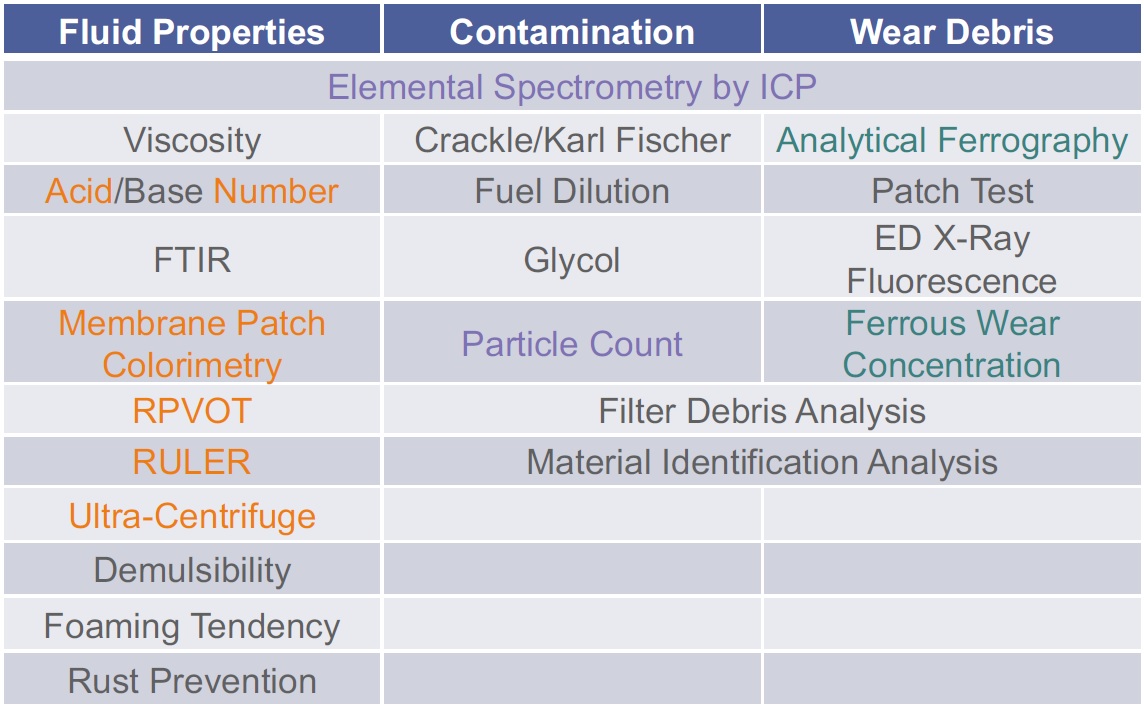
Figure 1. Various lab tests provide different kinds of information on the properties and condition of a fluid. Purple highlights the tests in the section here titled Elemental analysis and particle counts, orange highlights the tests in the section titled Varnish and degradation detection, and teal highlights the tests in the section titled Metallic wear particles.
Elemental analysis and particle counts
Elemental analysis techniques, most commonly inductively coupled plasma atomic emission spectroscopy (ICP-AES) (see Figure 2), detect, identify and quantify metallic elements and several nonmetallic elements by measuring the light spectrum emitted (see Figure 3) when a diluted, aerosolized oil sample is sprayed into a plasma jet or flame (ASTM D5185). Elemental spectroscopy is an important part of equipment condition monitoring. Unexpected results can signal that an incorrect fluid is being used (i.e., different additives or additive concentrations) or an increase in wear metal particles. However, these methods do not identify the sources of the elements, which can include additives, wear particles or contaminants. They also say nothing about additive levels, whether a metal-containing additive is functioning properly or if it has reached the end of its useful life. “Elemental analysis doesn’t tell you if the wear particles are Babbitt metal or bronze, just lead or copper,” Zabawski says.
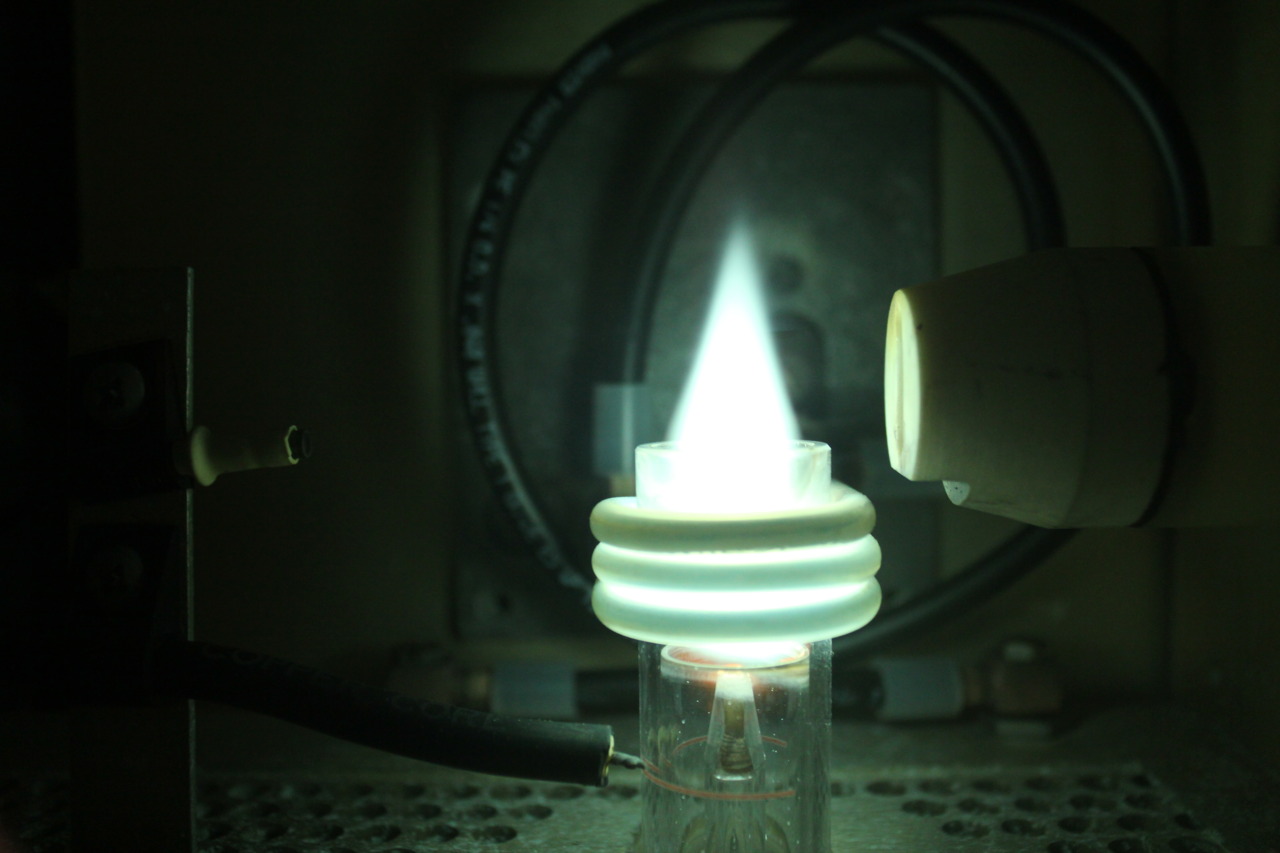
Figure 2. ICP-AES analysis measures the light spectrum emitted when an aerosolized sample is sprayed into a plasma. Figure courtesy of Wblanchard/Wikimedia Commons, CC BY-SA 3.0.
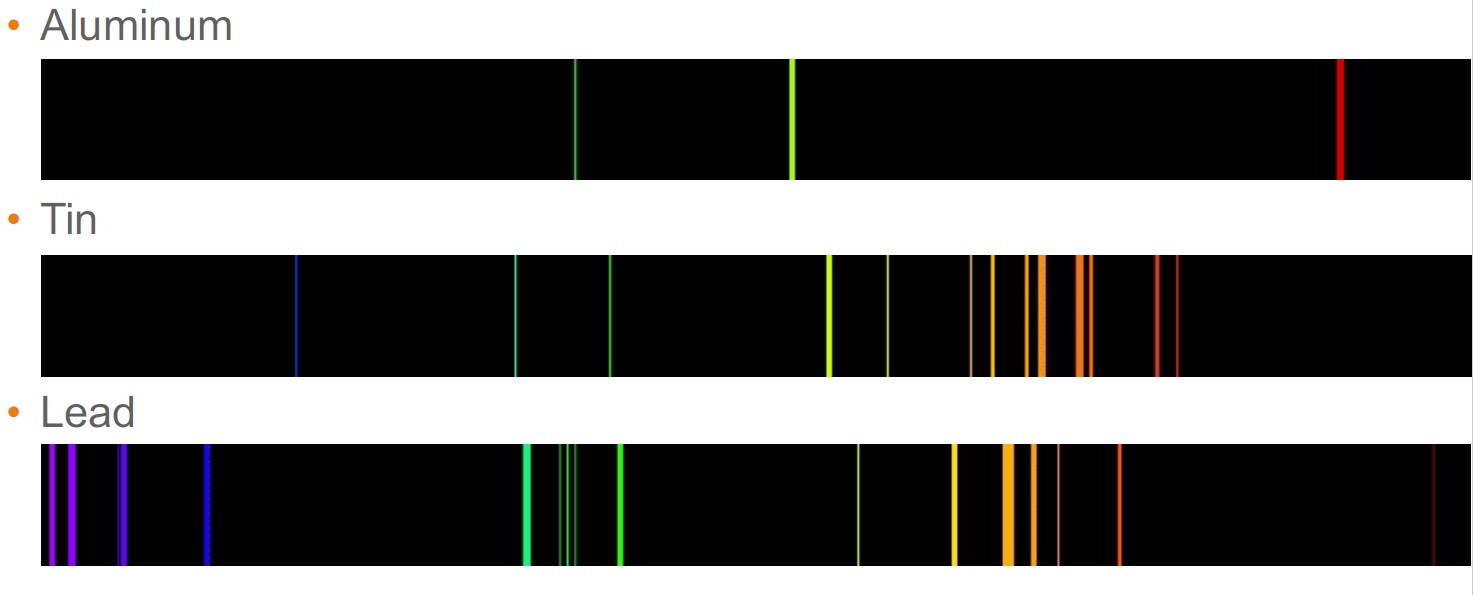
Figure 3. Each metallic element emits its own signature light spectrum in ICP-AES analysis.
ICP-AES measures the elemental makeup of aerosolized droplets, which cannot carry solid particles larger than about eight to 12 microns across. Thus, these methods work well for additive particles, normal wear particles or airborne contaminants. However, if severe wear or abnormal contamination has introduced large particles into the oil, supplemental testing may be required.
Particle counters using light beams or lasers (ASTM D7647) are useful for determining particle concentrations and size distributions, which, in turn, provides information about the effectiveness of the fluid filtration system and helps in deciding whether it’s time to perform a fluid change. However, most particle counters do not identify the compositions or shapes of the particles. Particle counters pass a thin stream of oil between a light source and a detector. An opaque particle interrupts the light beam, and the detector records the area of this shadow (see Figure 4). This area is converted into a spherical equivalent diameter. That is, the data processing algorithm assumes that each particle is spherical, even particles with elongated or irregular shapes.
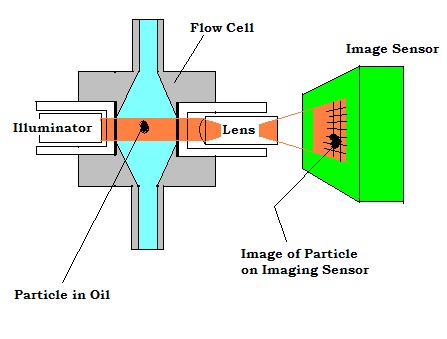
Figure 4. Particle counters record the areas of shadows that particles in a sample stream cast onto an image sensor. Figure courtesy of Canty1234/Wikimedia Commons, CC BY-SA 3.0.
Thin, flat particles with one large dimension may have small enough spherical equivalent diameters to be excluded from the particle count. For example, if a particle casts a 10-micron by 1-micron shadow on the detector, the area of this shadow is 10 square microns. A sphere that casts a 10-square-micron circular shadow has a diameter of 3.6 microns. However, most particle counters do not report particles smaller than 4 microns across, so even though this particle has one dimension that is well above this limit, the particle would not be reported. On the other end of the size range, particles too large to flow freely in the 100-micron-thick sample stream (anything with a spherical equivalent diameter larger than about 200 microns) will not be counted.
Anything that casts a large enough shadow on the detector, including soft varnish particles, air bubbles or water bubbles, as well as metallic wear particles or contaminants, will be reported as a particle, which can skew results toward high values. Laboratory samples can be diluted and sonicated before testing to eliminate these interferences, but field samples are usually tested as collected.
Another means of counting particulates is a pore block count, in which samples are run through a standard screen with a uniform pore size at a set pressure (see Figure 5). The flow rate is measured on the exit side to determine how much material is caught in the screen. Other reported particle sizes are estimated based on extrapolation from the results obtained from this screen. The screen’s pore size is selected based on the anticipated cleanliness of the sample. The advantage of the pore block count method is that there are no interferences from air or water bubbles or soft varnish particles.
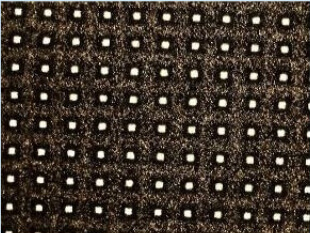
Figure 5. Pore blockage particle counters record the reduction in flow caused by particles trapped in a calibrated screen. Figure courtesy of Eurofins TestOil.
Although elemental analysis and particle counts both report concentrations of solid materials in an oil sample, the results of these analyses don’t correlate with each other. Neither particle counts nor pore block tests measure the exact dimensions of a particle, and they can misinterpret samples with atypical particle shapes or distributions. Particles must be large enough to be reported but small enough to flow through the sample stream. Elemental analysis methods report the total amount of specific chemical elements in an aerosolized spray containing the oil, without providing information on sample sizes or shapes. Further, only the smallest solid particles are suspended in the aerosol, so the two types of analysis may not be looking at the same populations of particles. For example, carbon particles (e.g., from soot) will show up in a particle count, but not in an ICP test.
However, comparing the two types of tests can provide useful information in terms of particles that show up in one test but not the other. Small particles that show up in elemental analysis but not particle counts may indicate normal wear or contamination levels. Particles too large to be suspended in an ICP-AES sample, but that show up in particle counts, may indicate an abnormal wear or contamination condition.
Varnish and degradation detection
Several types of tests detect varnish caused by oil degradation. However, there is no definitive test for varnish in a system, since each test measures what’s in the oil sample and not necessarily what’s in the system through which the oil circulates. Each test measures something different, so it’s important to understand what each type of test does and does not imply.
Acid number, sometimes erroneously referred to as “total acid number” or TAN, is commonly used to detect oil degradation, but it only records the concentration of strong acids (those with large dissociation constants). An increase in acid number over time indicates that the oil is degrading, but some oils are intentionally acidic, so it’s important to know the acid number of the new oil before making comparisons. Because acid number is a lagging indicator, by the time an increase is detected, the oil may already be significantly degraded.
Colorimetric acid number tests (ASTM D974) rely on chemical titration, in which an alkaline solution is added dropwise to the oil sample. An indicator compound changes color to mark the endpoint, the amount of alkaline solution needed to exactly neutralize the acid content in the sample. If the sample is dark in color, the color change at this endpoint can be hard to detect. Potentiometric titration (ASTM D664) is very similar to colorimetric titration, but this method detects a change in electrical conductivity in the oil when the acid is neutralized (see Figure 6), so color does not interfere with this method. Water can bias the results of both types of titrations; weak acids that have dissociated can become stronger, and thus be measured, in samples with a high water content. (If this happens, the water contamination itself may be a source of problems.)
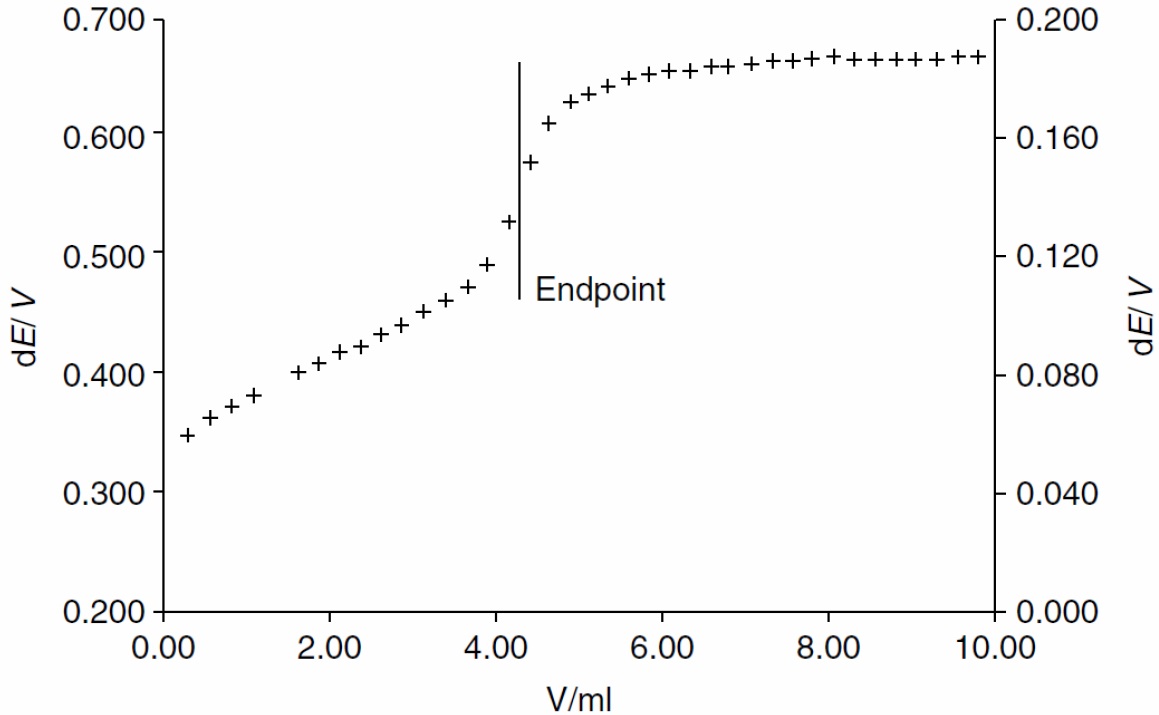
Figure 6. Potentiometric titrations measure strong acid concentration by recording a change in conductivity when the acid is neutralized. Figure courtesy of Gresham, R. M. and Totten, G. E. (2008), Lubrication and Maintenance of Industrial Machinery: Best Practices and Reliability, Boca Raton, Fla: CRC Press.
Degraded oil may have less stability against oxidation. One way to detect trends in oxidation stability is to periodically run a rotating pressure vessel oxidation test (RPVOT, ASTM D2272) and compare the results with those from a fresh sample of the same oil. In this test, a vessel containing an oil sample, water and a polished copper coil is pressurized with pure oxygen (see Figure 7). The oxygen reacts first with the antioxidant additives in the oil, but once the antioxidants have completely reacted, the excess oxygen begins to react with the copper and the oil itself. The ability of the oil to resist oxidation is measured as the amount of time it takes for the oxygen pressure inside the vessel to drop by a specified amount. Note that this test is only applicable to oils that have antioxidant additives, which rules out some phosphate esters and other oil formulations.
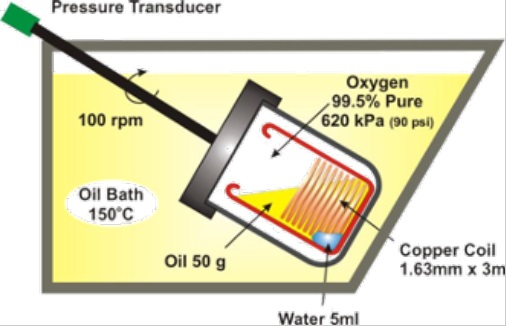
Figure 7. RPVOT tests measure oxygen uptake by antioxidant additives in an oil sample. Figure courtesy of Thibault, R. (2014), “Use of ASTM tests in the evaluation and selection of industrial lubricants,” TLT, 70 (4), pp. 30-37. Available here.
This type of test tends to be expensive, but there are no interferences. It’s important to establish a baseline with a sample of fresh oil and take periodic measurements over the life of the oil, rather than relying on a single test result. It’s also important to know the characteristics of the oil. Some new oils exhibit a break-in period, in which the level of oxidation protection decreases rapidly before leveling out. Other oils show a steady decline over time, while still providing adequate protection.
RPVOT tests do not indicate whether acids or insoluble species are forming in the oil. Thus, membrane patch colorimetry (MPC, ASTM D7843) is a useful complementary test for detecting insolubles, which could lead to varnish or other deposits. An oil sample is run through a membrane, and a handheld spectrophotometer accurately records the color of the deposit on the membrane (see Figure 8). The MPC test does not indicate any insoluble species that have deposited out, merely the species that are circulating through the system and have been collected from the oil sample. Carbon particles (e.g., from electrostatic spark discharge or microdieseling) can darken an oil and potentially skew the results.
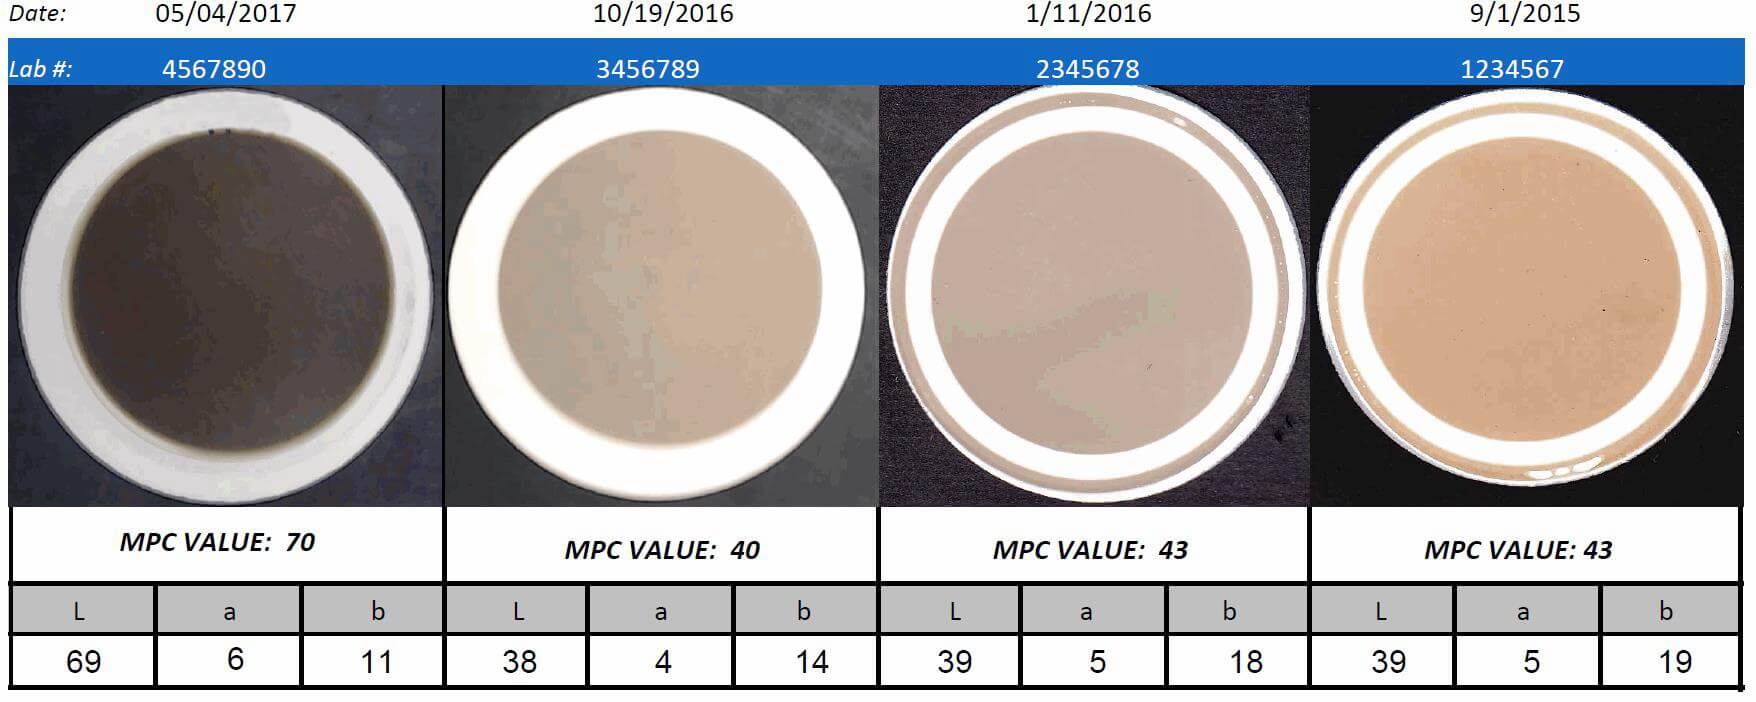
Figure 8. Membrane patch colorimetry detects the color darkness of insoluble deposits collected from an oil sample. Figure courtesy of Eurofins TestOil.
Because the MPC method measures only the current level of insolubles in the oil sample, meaningful results rely on trending by repeating the test over time. A darkening of the oil sample, followed by a plateau or a decrease in the darkness of the oil, can indicate that insolubles are depositing onto the mechanical parts in the system, as would a sudden decrease in MPC value without a correlating maintenance activity like a fluid change or micro-filtration.
Like MPC, ultracentrifugation measures insoluble species, including varnish particles, in an oil sample. The sample is placed into a test tube and spun at a high speed for half an hour. Centrifugal force drives the particles toward the bottom of the test tube, with the largest particles accumulating nearest the bottom. A calibrated scale is used to examine the particle distribution at the end of the test (see Figure 9). Because of the high speeds involved, the sample may heat up and solubilize some components of the sample. Cooling the sample to avoid this may cause some components to come out of solution, so temperature control is important for achieving accurate results. Also, the heavier liquid components of the oil sample (e.g., water) will migrate to the bottom of the test tube, along with the heavier particulates. Ultracentrifugation is faster and easier than MPC, but the results are qualitative rather than quantitative. Like MPC, the results indicate only what is present in the oil sample rather than what may have deposited out.
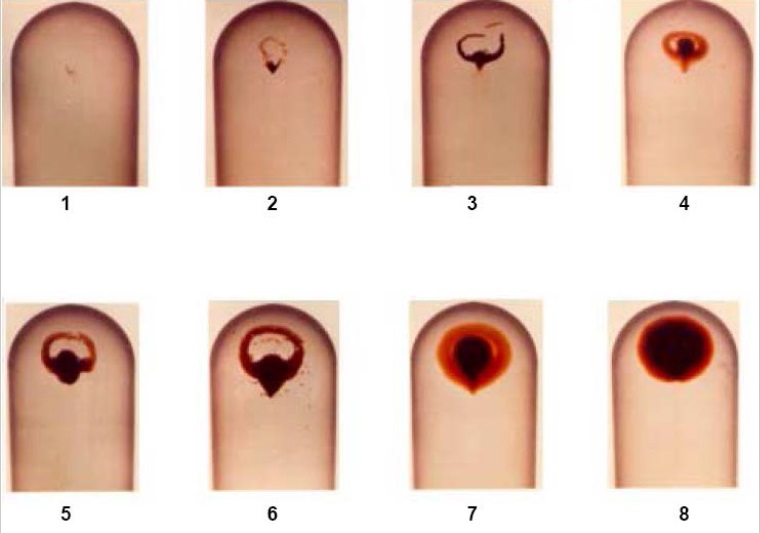
Figure 9. Ultracentrifugation drives the heaviest components of an oil sample to the bottom of a test tube, and an 8-level scale is used to evaluate the results.
Remaining Useful Life Evaluation Routine (RULER®) analysis (ASTM D6971) measures the remaining useful life of an oil as a function of hindered phenol and aromatic amine antioxidant levels. An electrolyte is added to an oil sample to separate out the antioxidant additives. A steadily increasing voltage is applied to the additive sample, and the amounts of these additives are recorded as peaks in a voltammogram—a plot of measured electrical current over time, which corresponds to the applied voltage (see Figure 10). This method measures trends in antioxidant levels, and periodic tests on used oil must be compared to a baseline test on a fresh sample of the same oil.
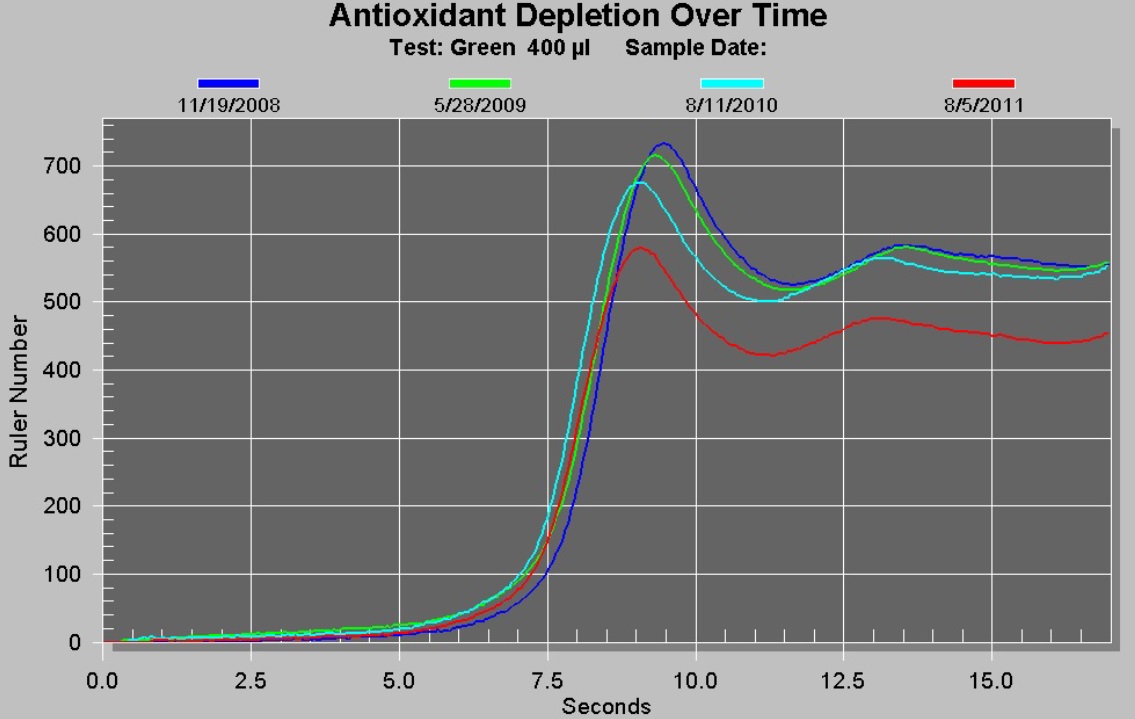
Figure 10. RULER analysis measures levels of antioxidant additives extracted from oil by applying a steadily increasing voltage over time and recording electrical current changes. Figure courtesy of Eurofins TestOil.
RULER and acid number measure properties of the oil (antioxidant levels and acidity, respectively), RPVOT measures performance (oxidation resistance) and MPC and ultracentrifugation measure outcomes (formation of insoluble species). Thus, although the results of these five tests cannot be expected to correlate with each other, they can provide complementary information that, with insightful interpretation, can give useful indicators of what is happening inside a mechanical system.
Metallic wear particles
The wear particle concentration (WPC) test identifies all types of ferromagnetic particles. Thus, cobalt and chromium, as well as iron or steel, can show up in WPC tests. This test measures the total content of ferromagnetic particles in an oil sample, regardless of shape or size, using the particles’ disturbance of a magnetic field as an indicator. Like many other test methods, WPC is best used as a trend indicator.
If WPC tests show results over a certain limit, follow-up testing may be in order. One such test, analytic ferrography, uses microscopy to identify the sizes, shapes and colors of particles (ASTM D7690). Because a human interprets the test results, this introduces a degree of subjectivity. To help in interpreting test results, an analyst may make a ferrogram by dribbling a small amount of oil down a glass slide with magnets on either side to sort the particles by size and magnetic properties (see Figure 11). The analyst classifies the particles into one of 12 categories. For example, normal wear particles are caused by rubbing wear and rolling contact fatigue, and they fall below a certain size limit. For the patch method of analytical ferrography, a heptane-diluted sample is passed through a 0.8-micron membrane patch, and the particles deposited on the patch are analyzed microscopically (see Figure 12).
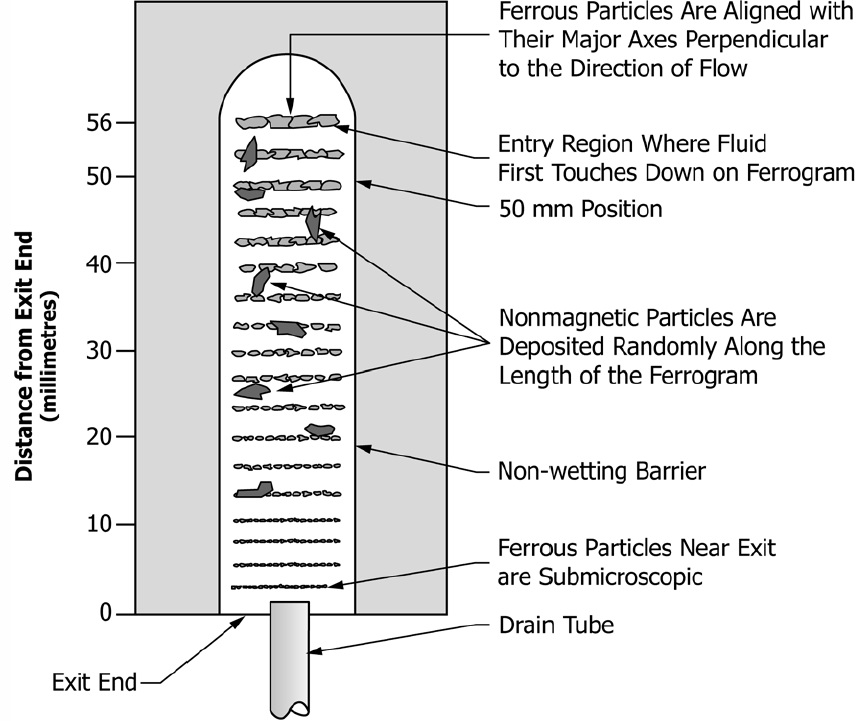
Figure 11. A ferrogram sorts ferromagnetic particles by size and magnetic properties. Figure courtesy of ASTM D7690-11, Standard Practice for Microscopic Characterization of Particles from In-Service Lubricants by Analytical Ferrography, ASTM International, West Conshohocken, Pa., 2011.
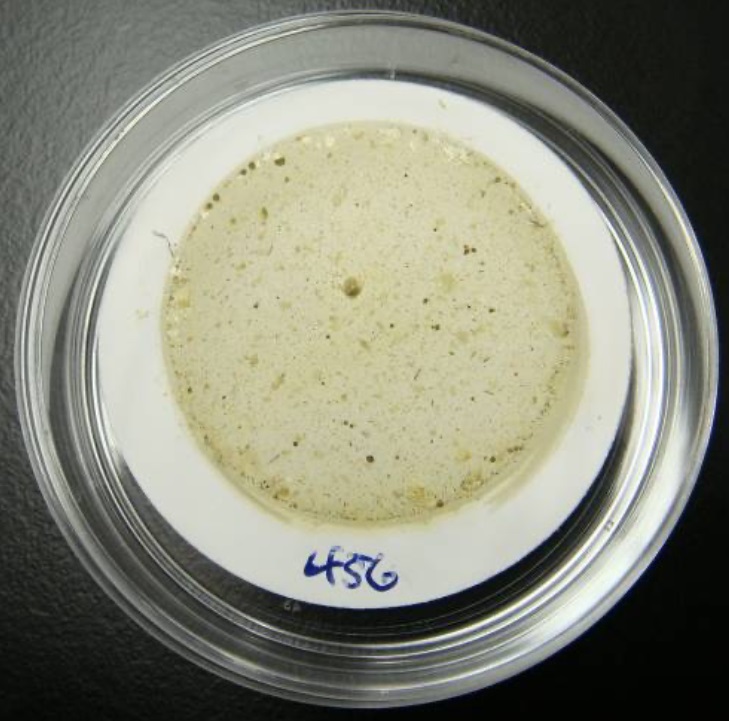
Figure 12. The patch method of analytical ferrography uses microscopy to analyze particles deposited on a membrane. Figure courtesy of Eurofins TestOil.
Even though WPC tests and ferrography may be looking at the same particles, the approaches are very different. Because neither of these tests is limited by particle size, the results do not correlate with size-limited tests like elemental spectroscopy or particle counts.
Making sense of it all
A lack of correlation between tests can actually yield useful information, Zabawski says. You have to know what information each test provides and doesn’t provide and use this understanding to select the most relevant tests and make meaningful comparisons of the results. In addition, information gained from identifying trends—and deviations from these trends—can tell you more than an individual test.
Are lab results accurate? It depends on the test, Zabawski says. Again, it’s essential to know how inherently accurate a particular type of test is and the types of factors that can interfere with or bias the test. For example, particle counts can vary within a wide range and still be considered accurate, but viscosity test results, with their inherently greater precision, vary within a much narrower range. If particle counts or component concentrations fall outside the limits of a particular test (one sign of this is a deviation in a trend of previous tests), follow-up testing may be required. If you’re not sure whether a change in results reflects a change in your oil or the variability inherent in a test method, ask your lab to go over this with you.
Nancy McGuire is a freelance writer based in Albuquerque, N.M. You can contact her at nmcguire@wordchemist.com.