KEY CONCEPTS
•
The resiliency of the U.S. electric grid when renewable energy resources are included was evaluated through the use of a hetero-functional graph.
•
The U.S. electric grid was subjected to a series of hypothetical disruptive attacks that are random, weather related or targeted cyberattacks.
•
Resiliency of the U.S. electric grid will increase in moving to a decarbonized system architecture.
The move toward a decarbonized energy system, which will include the transition from internal combustion engines to electric vehicles, will place more stress on the electric grid, because consumers and commercial users will need to recharge their cars on a continual basis. The question that arises is, can the electric grid handle the added stress?
A previous TLT article
1 discussed research that found the electric grid will be stressed in localized areas where clusters of consumers may charge their electric vehicles at the same time. The author of this research expressed added concern that a significant burden could be placed on transformers reducing their operating lives. Another factor is the type of charging device used. If more consumers move to a Level 2 charging device that operates at 240 volts and is much faster than a Level 1 charger, then the electric grid will be further stressed, leading to the need for upgrading the distribution infrastructure.
As wind energy and solar energy become more important contributors to the electric grid, their use should extend the number of possible ways electricity can be generated. Amro Farid, associate professor of engineering at Dartmouth in Hanover, N.H., and research affiliate at the Massachusetts Institute of Technology (MIT), says, “Wind power and solar power are examples of distributed energy resources (DERs) that represent a broad class of energy sources that act at the periphery of the electric grid. Other examples include housing and industrial buildings that utilize solar photovoltaic cells, fuel cells and batteries (including those used in electric vehicles). DERs are actively changing the traditional structure of the electric grid by facilitating the use of localized electricity sources that can interact with the traditional grid in which distribution lines radiate out from power transmission sources. This interaction includes not only drawing on the electric grid for power but also contributing power to the grid.”
With the growing use of DERs, the question is asked about how they might affect the resiliency of the continental U.S. electric grid. Farid says, “The issue of resiliency is an important one because it indicates how well the electric grid can withstand disruptions whether they occur through natural, artificial or nefarious means while continuing to supply power to consumer and industrial customers.”
Past efforts to evaluate resiliency have focused on analysis of power plants and transmission lines. Farid says, “In the preparation of a traditional or a formal graph of an electric grid, point nodes represent power plants, and lines and edges show transmission lines that move electricity from the power plants to consumers. This representation of a power grid provides a certain level of insight, but a richer model is needed to better understand that influence of renewable sources including DERs.”
Such an approach has now been conducted using a “hetero-functional graph.”
Platts Map Data Pro
The hetero-functional graph differs from a conventional formal graph in listing the different functions of nodes and edges in the electric grid. Farid says, “A formal graph that contains four nodes (a water treatment facility, a solar photovoltaic cell panel, a house with a rooftop solar panel and a work location) will appear as 12 nodes in a hetero-functional graph because some of the nodes may have multiple capabilities. For example, the house with rooftop solar panels has four nodes in the hetero-functional graph. Each node is considered to be a capability. The same approach applies to edges that are identified in the hetero-functional graph, as transportation capabilities and their functions are linked to show the direction of the power flow through the grid.”
To evaluate the resiliency of the U.S. electric grid, the researchers used the Platts Map Data Pro data set to produce a hetero-functional graph. Farid says, “This database is used intensely in the energy sector because it provides many types of data including coal, oil, gas and electricity. It constitutes a Geographic Information System (GIS) database that contained 13,568 power plants, 34,469 generation units, 78,880 substations and 104,329 transmission lines.”
A visualization of the U.S. electric grid is shown in Figure 1.
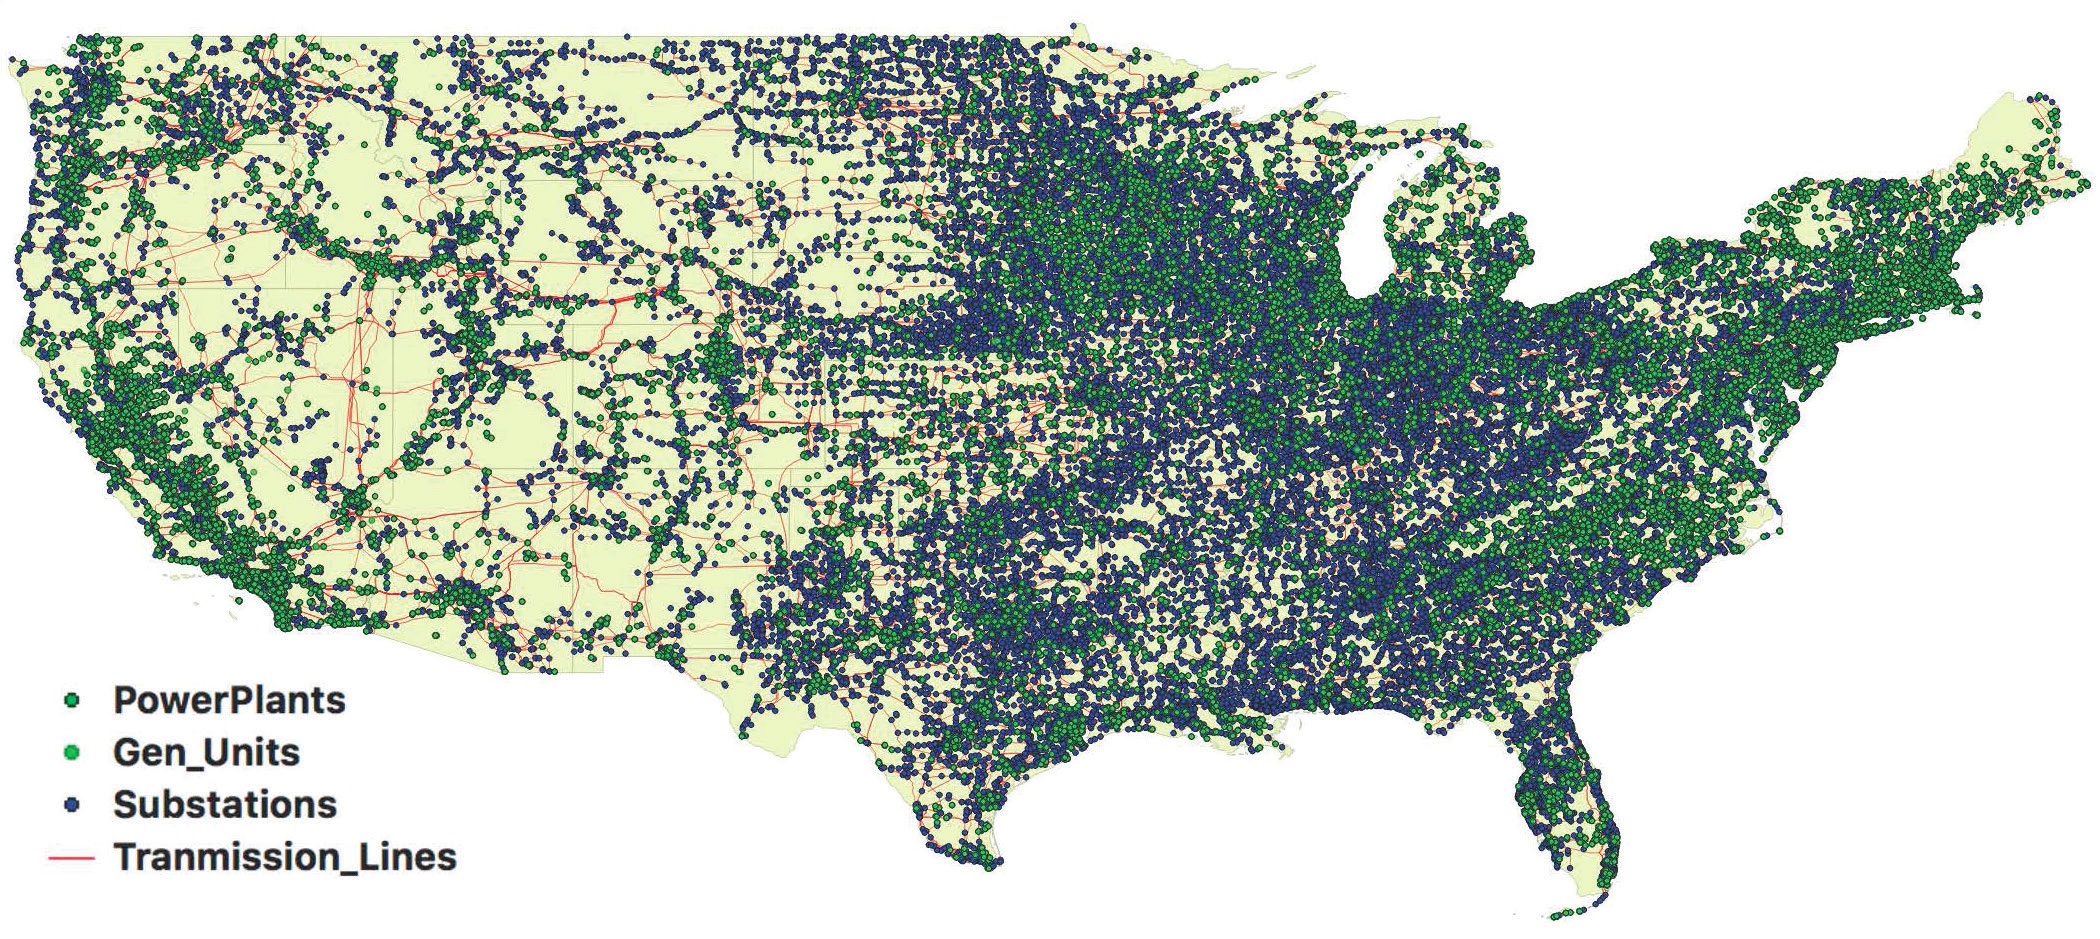 Figure 1. The Geographic Information System (GIS) can be used to produce the visualization of the U.S. electric grid shown, which includes power plants, generation units, substations and transmission lines. Figure courtesy of Dakota Thompson/Dartmouth.
The challenge facing the researchers was to convert the information in the GIS database to a mathematical representation. Farid says, “We were able to take the information from the GIS database and generate formal and hetero-functional graphs. The additional information found in the hetero-functional graph allowed us to obtain a better picture about the resiliency of the U.S. electric grid.”
The researchers subjected the U.S. electric grid to a series of hypothetical, disruptive attacks that Farid termed as random, weather related or targeted cyberattacks. When including distributed generation, energy storage resources (such as batteries and electric vehicles) and meshed power distribution lines, the hetero-functional graph shows that the resiliency of the U.S. electric grid is enhanced in the presence of random and targeted disruptions.

Farid says, “Our analysis shows that as the U.S. electric grid moves to a decarbonized system architecture, resiliency will increase—meaning that disruptions will not lead to as many outages. In effect, the move toward energy sustainability will not negatively affect the resiliency of the electric grid.”
The researchers plan to expand their scope by developing a synthetic model of the American Multimodal Energy System (AMES) that includes not only electric power but also oil, natural gas and coal infrastructure. Farid says, “Our objective is to develop a single model of the entire U.S. energy system that can provide guidance on how the shift to decarbonization will be able to meet current and future needs.”
Additional information on this research can be found in a recent article
2 or by contacting Farid at
amfarid@dartmouth.edu.
REFERENCES
1.
Canter, N. (2018), “How will the growing use of plug-in electric vehicles affect the power grid?” TLT,
74 (4), pp. 12-13.
2.
Thompson, D., Schoonenberg, W. and Farid, A. (2021), “A hetero-functional graph resilience analysis of the future American electric power system,”
IEEE Access 9, DOI: 10.1109/ACCESS.2021.3077856