Emerging technologies advance traditional condition monitoring techniques
Dr. Neil Canter, Contributing Editor | TLT Feature Article December 2019
Lubrication engineers extend machine life by integrating lab analyses with online-generated data.

© Can Stock Photo / aapsky
KEY CONCEPTS
•
New condition monitoring techniques provide clearer insights to enable more efficient problem solving, leading to better lubricant and machinery reliability and less downtime.
•
The growing use of sensors is enabling more online techniques to be developed to monitor systems remotely in real time.
•
The future of condition monitoring looks bright as artificial intelligence will be implemented to enable machines to interact with each other to solve operating problems and optimize the manufacturing process.
Monitoring of lubricants and the machinery where they are used is becoming more important as end-users wish to extend operating life for as long as possible. End-users are requiring lubricants and machinery to operate at optimum levels under more demanding conditions. To achieve this objective, lubricants and machinery have to be monitored to ensure that they retain the original operating characteristics needed to do their required tasks.
Condition monitoring, i.e., fluid analysis, is continuing to be a valuable tool needed to assess the properties of lubricants and machinery periodically. The value of this technique is increasing because end-users have fewer resources available to them, and if a specific machine is not performing up to expectations, the use of condition monitoring is essential to find the root cause and determine a solution as quickly as possible in real time.
The purpose of this article is to get an update on new test procedures that have been implemented to assess the condition of lubricants and machinery. Key industry experts were contacted to gain their perspective on new developments in condition monitoring.
The following experts were interviewed.
1.
Dr. Aaron Mendez, Ayalytical Instruments
2.
Jack Poley, Condition Monitoring International
3.
Dr. Deepak Veeregowda, Ducom Instruments Europe
4.
Greg Livingstone, Fluitec
5.
Allison Toms, GasTOPS
6.
Dr. Thomas Fischer, OELCHECK.
Alloy classification of wear debris
STLE-member Allison Toms, senior technical consultant to GasTOPS Inc. in Huntsville Ala., and former vice president of technology and engineering services, has focused on using techniques to monitor wear debris. She says, “Since the 1940s, wear debris analysis has been determined by bulk elemental analysis of debris in oil. On or about the year 2000, individual particle analysis utilizing Scanning Electron Microscopy Energy Dispersive X-ray (SEMEDX) was applied in broader applications to oil analysis, particularly for aviation, rather than primarily being utilized for detailed post-mortem failure analysis. However, SEMEDX, although simplified from a research grade instrument, was still complicated, difficult to operate and utilized a 900-pound instrument, making it difficult to use in field applications.”
Toms indicates that a new analytical technique utilizing Laser-Induced Breakdown Spectroscopy (LIBS) (
1, 2) for individual wear particle determination represents a fundamental change in oil analysis. She says, “The availability of specific particle alloy identification means that the need to interpret elemental results is eliminated. Specific alloy classification of wear debris improves failure detection often missed by bulk elemental analysis. This technique was initially designed for high value machinery such as aircraft.”
Toms continues, “Short laser pulses create micro hot-plasma ablation of debris, and then spectroscopic tools are employed for analysis. The wear debris can originate from chip collector and chip detector devices, filters, ferrograms and loose particles. This technique is currently in use globally by commercial aviation, military and MRO industries and OEMS.”
An example can be found in the analysis of a patch for an aircraft engine shown in Figure 1. Toms says, “Size detection ranges from particles as small as 70 microns and up into thousands of microns. Alloy classification rates are greater than 95% for all 23 alloys tested, greater than 97% for some. The technique that we use takes a few minutes to analyze up to 20 particles by alloy and size. It is small, lightweight, easy to operate and deployable.”
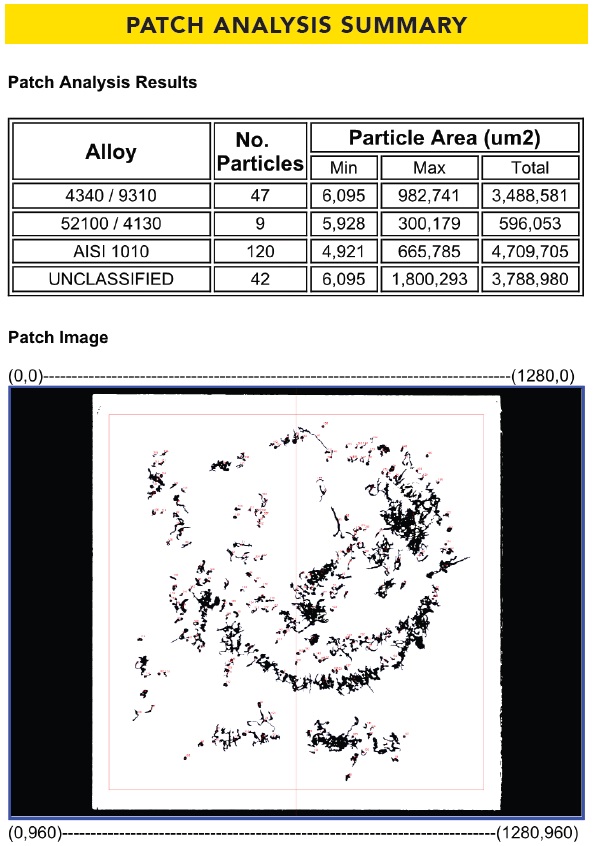 Figure 1. Classification of the alloys present in a patch for an aircraft engine was conducted using a technique known as LIBS. (Figure courtesy of GasTOPS Inc.)
A complementary technique known as Advanced Oil Fines Analysis (AOFA), identifies wear debris particles in lubricants by alloy and by particle size down to 0.5 microns along with the concentrations of each alloy to provide enhanced knowledge on damage severity (
3). Toms says, “AOFA presently utilizes a SEMEDX to analyze and identify alloys in particles. This technique is currently used by airlines to profile their engines and provide significantly advanced notice of impending failures. Research is currently underway to incorporate this technology into a smaller, compact LIBS approach.”
Figure 2 compares an AOFA analysis versus atomic emission spectroscopy (AES) on two aircraft engines. Toms says, “Two distinct failures occurred, yet AES results were identical for both engines. In contrast, AOFA evaluated each particle and generated detailed alloy results. The difference in the two techniques is that AOFA analyzes particles individually while AES is providing a bulk chemical/elemental analysis of all particles together.”
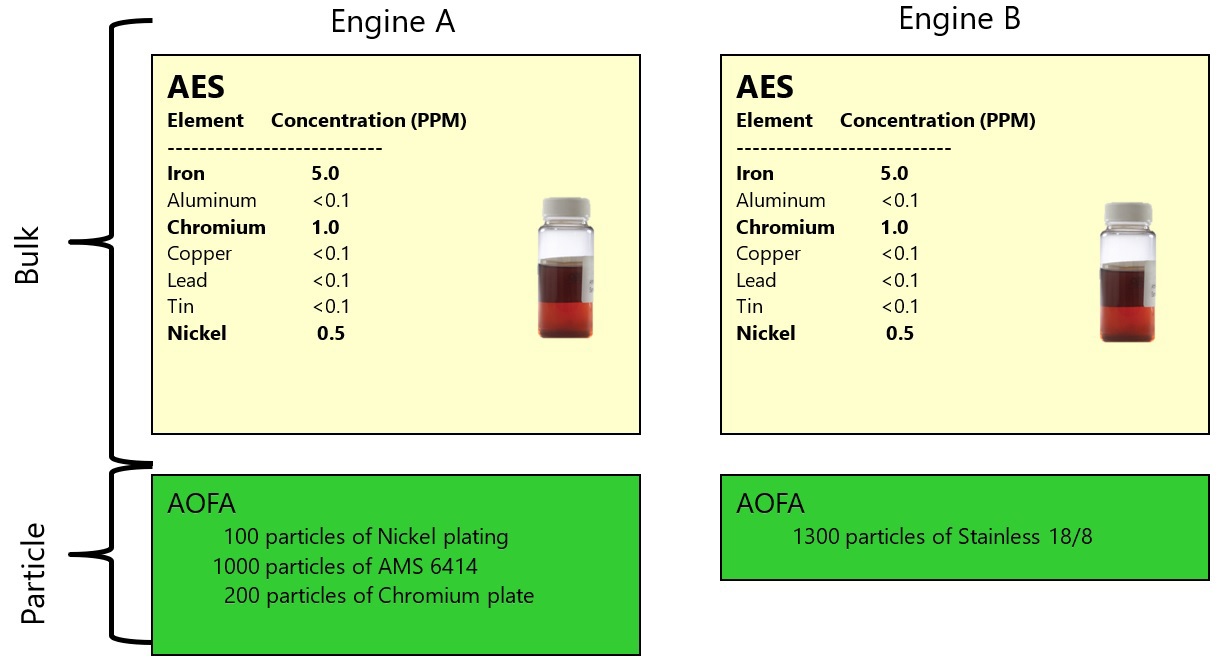 Figure 2. Atomic Emission Spectroscopy (AES) and Advanced Oil Fines Analysis (AOFA) were both conducted on two engines that failed. AOFA analyzes particles individually and produced detailed analysis about the specific alloys detected. In contrast, AES provides a bulk chemical/elemental analysis for all particles together producing identical results that do not provide clues as to why both engines failed. (Figure courtesy of GasTOPS Inc.)
Another benefit for wear particle analysis utilizing LIBS is to have instrumentation that is portable, easy to use and provides results in a prompt timeline. Toms says, “The military in particular wanted a smaller, more rugged and easier-to-operate instrument.”
Toms provides an example of an operator of turboprops that used AOFA to detect a problem that could not be identified by spectrometric oil analysis. She says, “After a warning light detected a problem, an oil sample was tested by AOFA, which confirmed the operator’s suspicion that the cause was deterioration of a carbon seal. Proactively, engine removal was scheduled for the next downtime and carbon seal deterioration was confirmed. The turboprop operator detected this problem over 700 hours prior to scheduled removal of the engine resulting in a savings of approximately $400,000 by avoiding delays, cancellations and secondary damage.”
Toms believes there is always the desire for enhanced diagnostics and prognostics in machinery monitoring. She says, “Knowing the specific alloy(s) and number of each alloy particles provides enhanced granularity with detailed information on the components wearing. This knowledge provides more in-depth failure analysis and advance failure notice. Adding the concentration of each alloy enhances knowledge on damage severity.”
Transportable lab
STLE-member Jack Poley of Condition Monitoring International in Miami, Fla., also feels that the availability of portable instrumentation has led to new condition monitoring test procedures. He says, “Speaking primarily for fluid analysis, portable testing, including handheld instruments, are playing a significant role in what is perceived as a growing movement ‘toward the machine,’ i.e., the advent of packaged onsite laboratories that include the most popular tests currently employed, including AES (atomic emission spectroscopy) wear metals. This is reflective of the innate (real time) quest for instant gratification, in terms of data from which an evaluation can be rendered ASAP.”
The goal in real-time condition monitoring is the use of sensors. Poley says, “Sensors are relatively new (circa 2000) to fluid analysis but still are not stable enough to always survive in a hot, often-contaminated lubricant environment. But fluid analysis sensors cannot compete with vibration sensors because data are too incomplete due to instrument capabilities restrictions such as only being able to detect ferrous wear, rather than other necessary wear metals (copper, lead, aluminum, etc.). Another element, silicon, used to detect abrasives, cannot be detected by currently available sensors. A progression that begins to have onsite laboratories increasingly gaining ground on offsite laboratories will occur as sensors begin to gain more sensitivity and begin to mimic the full gamut of lubricant testing for condition monitoring.”
Poley gives an example of a fully fitted transportable lab that features X-ray fluorescence spectrometer as the wear metals inspection method. He says, “This approach is able to detect short-term failure possibilities by quantifying large wear metal particles (greater than four microns) (
4) beyond iron to other wear metals.”
This technique can be adapted in Poley’s opinion to evaluate in-service lubricants for net effective lubricity. Poley says, “Reductions in film strength can lead to excessive boundary lubrication that can throw off large particle wear metal (LPWM) analysis.”
Online testing techniques are under development but not yet ready for commercial use. Poley says, “The technology is not quite there for online/inline analysis other than for iron at a rather limited 40-micron detectability limit at best. My expectation is that we are about five to 10 years out in terms of practicality or affordability.”
Poley indicates that in the future such instrumentation will include artificial intelligence software since such applications already exist. He says, “This development, fully realized, will elevate condition monitoring fluid analysis to not just provide real-time analysis but also offer auto-diagnosis and advisory rendering.”
Most advancements in condition monitoring have not been in technology used to conduct tests but in improving the ease and speed of performance. Poley says, “No truly new parameters have been developed during the past five years except for the transportable laboratory. The focus has been on accelerating the execution of monitoring tests without degradation in detection and quantification quality.”
Tribometers
Convenience is a key characteristic for Dr. Deepak Veeregowda, head of global marketing and sales for Ducom Instruments Europe B.V in Gronigen, The Netherlands. He says, “We are now being asked to utilize tribometers (designed to measure the friction and wear of lubricants) in condition monitoring of lubricants during use. This tool is used in combination with conventional tools such as spectroscopy techniques that establish a correlation between additive depletion in a lubricant and machine performance factors such as friction.”
Deepak points out that while spectroscopy can measure an increase in friction that infers that lubricant performance has declined, this technique does not necessarily confirm that the cause is additive depletion. He says, “Tribometers can help to investigate the root cause of lubricant performance and determine if an additive such as a friction modifier or an extreme pressure additive has become depleted while the lubricant is in use.”
Deepak gives examples of tribometers such as the KRL Shear Stability Tester used to measure depletion of viscosity modifiers, the high frequency reciprocating rig used to monitor friction modifiers and a four-ball tester that measures depletion of both friction modifiers and extreme pressure additives.
Figure 3 shows all three tribometers and indicates the lubrication regime where they function. Deepak says, “When deployed for condition monitoring, the tribometers can be used to measure coefficient of friction, specific heat, viscosity loss and wear scar diameter. Lubricant applications where the tribometers can be used include transmission oils such as gear oils and hydraulic fluids that are used in heavy and renewable energy industries.”
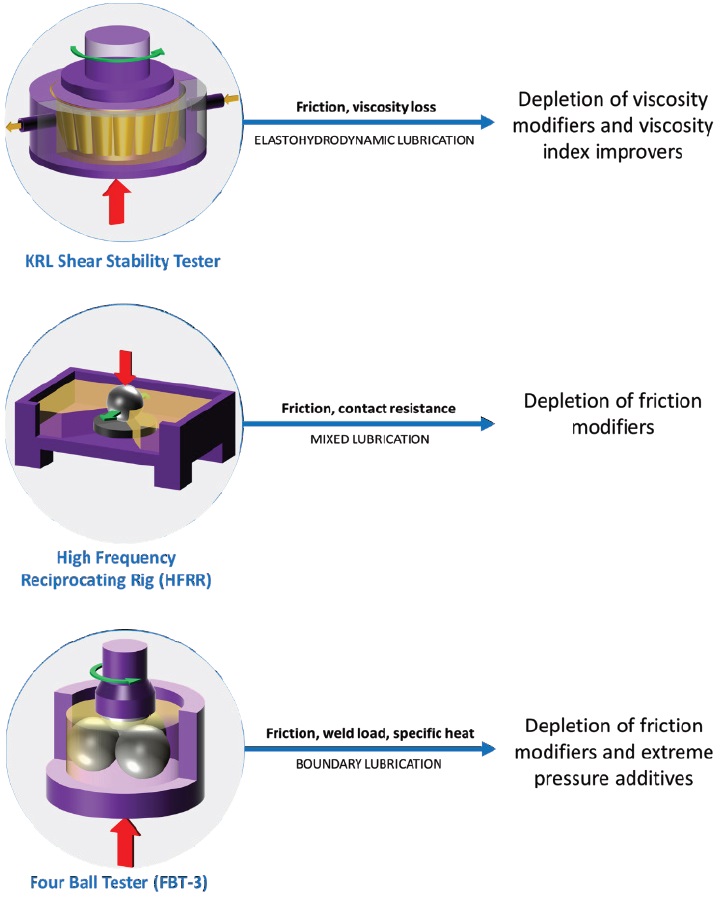 Figure 3. Three examples of tribometers (KRL Shear Stability Tester, High Frequency Reciprocating Rig and Four-Ball Tester) can be used to monitor the depletion of the specific additives shown. (Figure courtesy of Ducom Instruments Europe B.V.)
With the growing use of aluminum and other non-ferrous metal alloys, formulating lubricants with metal deactivators and monitoring their performance over time has become more important for end-users. A prime example is the evaluation of a synthetic gear oil used in a wind turbine. The expectation is that the gear oil must produce optimum performance while the turbine operates for many years.
HPLC
Dr. Thomas Fischer, scientific director for OELCHECK GmbH in Brannenburg, Germany, says, “The traditional technique for monitoring synthetic gear oils is Fourier-transform infrared spectroscopy (FTIR). It provides information which is based on the changes of the used oil through a comparison with the spectrum of a corresponding fresh- or reference-oil.”
Besides other results, FTIR can detect oil oxidation by the formation of oxygen bonds but, especially for the synthetic oils, this method cannot be used to quantify this phenomenon. Changes in the FTIR spectrum can only be quantified if the molecules present in the lubricant absorb the infrared light differently at different wavelengths. Polyalphaolefin (PAO) or ester oils are used as base oils for modern synthetic gear oils because they are more stable against oxidation over a long period compared to conventional Group I or II mineral oils.
Fischer continues, “In using mineral oil-based lubricants, the IR-method can be used to calculate oxidation by an increasing peak at a wave number of 1710 cm
-1. This peak is representative of carbonyl bonds. It rises continuously as the lubricant ages due to the introduction of oxygen into the hydrocarbon molecules. However, this approach cannot be used for ester-based lubricants because one of the main peaks for esters is present at a very close wave number of 1740 cm
-1. Therefore, the peak at 1710 cm
-1 cannot be used for synthetic oils to monitor oil degradation by oil oxidation.”
Since oil oxidation in synthetic gear oils are designed to remain in service for up to 10 years and cannot be monitored by the FTIR method, an alternative technique known as High Pressure Liquid Chromatography (HPLC) has been used to develop a method to gain additional information on those lubricants. In this field of industrial applications HPLC is commonly used to measure the inhibitor-depletion in water-based coolants. To develop the new method, synthetic gear oil samples taken out of a wind turbine gearbox over a period of six years, were used.
Fischer explains, “The main planetary gear of a 1.5 MW wind turbine is filled with approximately 600 liters of a synthetic gear oil. We analyzed the oil periodically over six years. The samples for the HPLC method were taken at 12,600, 43,800 and 52,700 operating hours. While all the values of the standard used oil analysis, as shown in Figure 4, indicated that the gear lubricant’s key parameters were within expectation, the oil became steadily darker, as shown in Figure 5. Even though there is no standard, a change in the color provides an initial appraisal to the tribology engineer, who is diagnosing each sample individually, of whether the composition of the lubricant may have changed over time.”
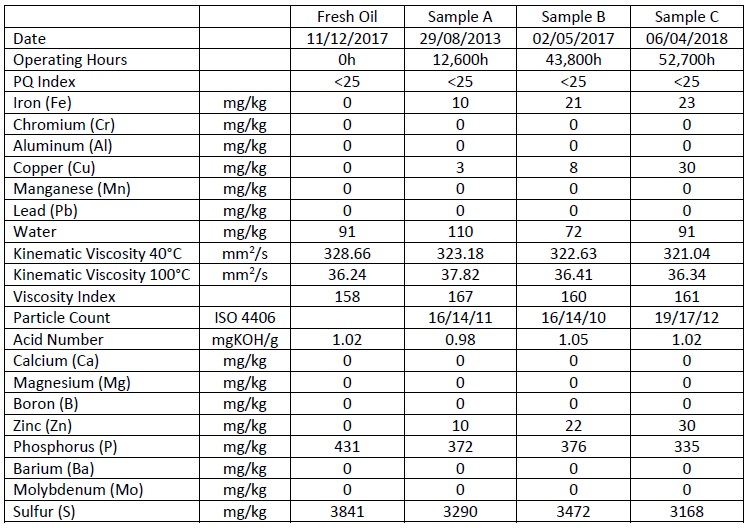 Figure 4. Standard used oil analysis on a synthetic gear oil was conducted at three specific times and showed that all of the lubricant’s key parameters are within expectation. (Figure courtesy of OELCHECK GmbH.)
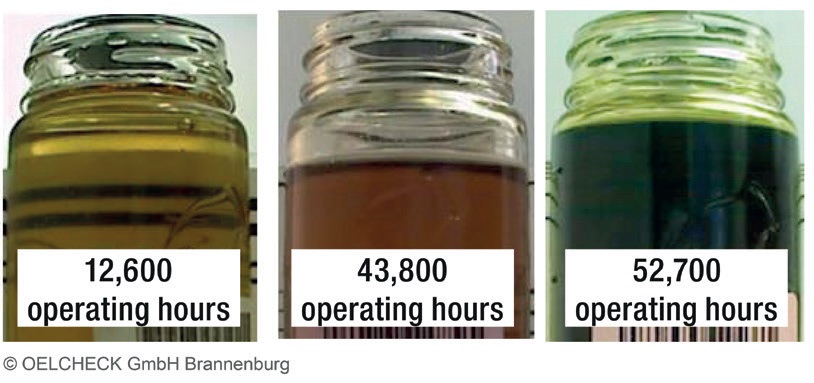 Figure 5. The color of the synthetic gear oil used in a wind turbine becomes progressively darker over time. (Figure courtesy of OELCHECK GmbH.)
Initially, the color of the oil sample after 12,600 hours was, like the fresh oil, light and clear. By the next samples, the oil discolored within a short period to dark brown. Fischer says, “This darkening of the oil did not provide any indication for whether lubricant performance was deteriorating, but it was alarming and led to further investigation of the oil’s characteristics. In reviewing the usual analytical data, we found that key parameters such as viscosity, viscosity index and water content, as well as an IR comparison, remained stable. Only the neutralization number (AN), a measure of acidity, increased barely. The key elements, phosphorus and sulfur, reflective of the additive components, only dropped slightly but remained within expectation. The wear metals, with the exception of copper, showed no increase. The diagnosis statement concluded that the oil could remain in service, however, because of copper, it should be analyzed at a shorter period.”
The copper content, which was within limits at 43,800 hours, increased significantly after 52,700 hours. This led to the recommendation that the oil has to be changed immediately. However, the copper content did not necessarily explain the discoloration of the lubricant. Fischer says, “We felt that the rise in copper might be an indication that the non-ferrous metal deactivator concentration in the gear oil had dropped. It was striking to us that both the high increase in copper levels and the dark discoloration of the gear oil had taken place within the relatively short period of less than 10,000 operating hours. Unfortunately we could not use any of the fast and relatively inexpensive traditional analytical techniques, including FTIR, to determine, whether and how much the metal deactivator concentration did change. Metal deactivator additives are usually based on azole chemistry and include such examples as tolyltriazole and benzotriazole.”
These metal deactivators are very effective in protecting copper-containing surfaces against corrosive wear. Unfortunately metal deactivators are consumed continuously. If they are not present in the lubricant, then copper corrosion will start. In windmill gear boxes, the main components where such corrosion will lead to catastrophic failure, are the cages of double-row spherical roller bearings. If these bearings fail, a very costly overhaul is the result. Fischer says, “Because we use the HPLC method regularly to measure the concentration of inhibitors in automotive coolants, we decided to also use this instrument to evaluate the metal deactivators in lubricants and define the remaining concentration of non-ferrous inhibitors in synthetic gear oils.”
The HPLC method was used to measure the concentration of tolyltriazole and benzotriazole in the fresh and used oil samples. Fischer says, “We found that the fresh oil displayed a high content of tolyltriazole. However, after the oil was used for 43,800 hours, we measured a significant decline in the concentration of this type of metal deactivator. The sample, which was in use for more than 50,00 hours, showed only a very small concentration of the non-ferrous metal deactivator. This decline in the deactivator content can be used as a strong indication that high copper content in the oil sample is caused by corrosive wear of the bearing cage because the additive is not present anymore. In our experience, non-ferrous metals such as copper, lead and tin can increase in concentration dramatically in a very short time when a system is running with a depleted inhibitor. The new HPLC method, presently not used as a standard for gear oil analysis, is an approach to monitor a possible source for the fast progressing corrosive wear.”
Fischer believes that if HPLC had been used to monitor the condition of the wind turbine gear oil, then the decline in metal deactivator concentration would have been identified already after 43,800 hours. He says, “Knowing these results, our tribology experts would have recommended that the gear oil must be changed with the next 2,000 operating hours because otherwise the wear of the hearing-cage will rapidly increase.”
The new HPLC method is, compared to the standard oil analysis methods, a time-consuming and expensive analytical technique, but the results from this case study justifies its use. Fischer says, “The process itself is relatively expensive due to the fact that every sample needs to be extracted using a solid phase extraction method prior to the HPLC analysis. However, the advanced warning made through HPLC analysis is justified because it will enable damage and cost-intensive repairs to be avoided.”
 © Can Stock Photo / guruxox
Membrane patch colorimetry test
© Can Stock Photo / guruxox
Membrane patch colorimetry test
STLE-member Greg Livingstone, chief innovation officer for Fluitec International in Bayonne, N.J., stated that the Membrane Patch Colorimetry Test (ASTM D7483) has made a significant contribution for condition monitoring of the deposit tendencies of turbine, compressor and hydraulic fluids. He says, “This procedure is able to predict when a fluid has potential to form deposits, allowing users to take proactive action prior to varnish formation.”
In the Membrane Patch Colorimetry Test procedure, a sample of the fluid is diluted with an equal volume of petroleum ether and filtered through a 0.45-micron nitro-cellulose membrane. Livingstone says, “The color of the oil-degradation products captured on the filter are measured by a spectrophotometer and compared to a control. The color difference or ΔE is then evaluated on the CIE scale to assess the magnitude of the deposits. This method enables end-users to take proactive action prior to varnish formation, which can have a detrimental effect on the lubricant.”
Livingstone continues, “The Membrane Patch Colorimetry Test is the only ASTM approved method designed to predict the deposit characteristics of in-service lubricants. Users of this method avoid having to react once a varnish deposit has caused a reliability issue.”
Livingstone points out that lubricant applications that are sensitive to deposits including turbine, compressor and hydraulic systems are most suitable for using this test procedure. He says, “Non-detergent mineral and synthetic industrial lubricants have proven to be effectively evaluated for deposit formation by this procedure. Lubricants with detergent/dispersant additive systems have not been extensively tested yet. One concern is that lubricants containing heavy amounts of contaminants will plug the membrane, making the test much harder to administer or requiring an augmented test protocol.”
Livingstone indicates that the majority of rotating equipment OEMs now recommend the Membrane Patch Colorimetry test as a key part of monitoring fluids used in their systems. He says, “Research is underway to develop an online procedure to adequately perform real-time deposit testing of lubricants. The hope is to enable end-users to more quickly determine the condition of their lubricant systems so that the necessary corrective action steps can be made.”
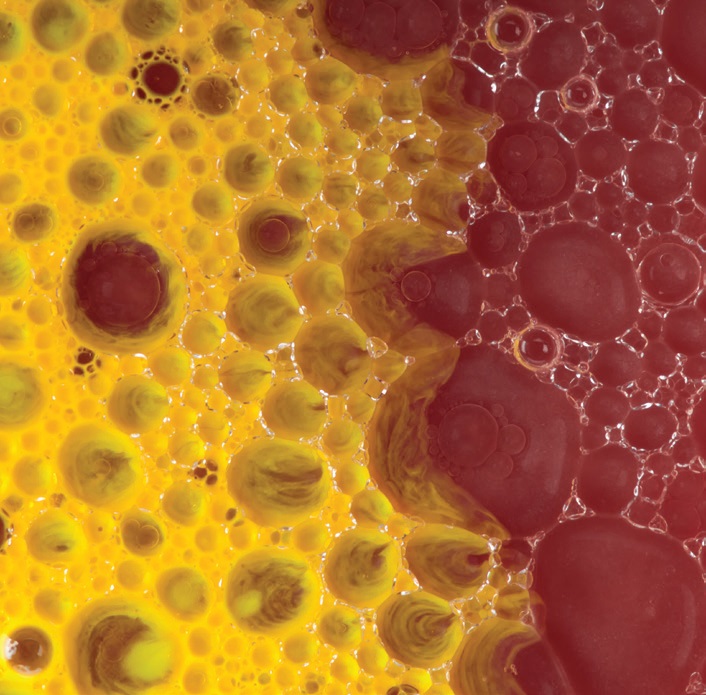
Foam
Foam or entrained air can adversely impact the performance of the lubricant. Among the problems that foam can create are reducing the ability of the lubricant to remove heat, increase the possibility of oxidation and result in poor fluid flow in applications such as hydraulic fluids. Dr. Aaron Mendez, director of research and applications at Ayalytical Instruments Inc. in Chicago, says, “The foaming tendency of lubricants is one of the most important properties to be measured in lubricants.”
Two of the methods used to measure foaming are ASTM D892 and ASTM D6082. Mendez says, “Both methods are somewhat operator-biased, suffer from poor precision and are prone to human error in sample preparation and handling. Other issues include the bulkiness of the test device, difficulty in handling oil samples to be tested and relatively long test period duration.”
A new foam testing apparatus (
5) has now been developed that uses standardized lighting, a high-resolution camera and a patent-pending algorithm to accurately and repeatedly measure foam height at the different experimental conditions of the two test methods. The apparatus measures foam formation, foam dissipation, foam height and air release.
Mendez says, “The new foam testing apparatus, actually under development for ASTM approval as a revision of the current D892 and D8062 standards, represents an improvement toward the sensitivity, precision and unbiased determination of foaming tendency of lubricants. It also improves throughput of samples, reduces uncertainty in the analysis and positively benefits the overall process of quality control and product characterization.”
Mendez indicates that the new foam testing apparatus is not in any way incompatible with lubricant formulations. He says, “Users of this technique will be able to develop applications to determine additive performance (defoamers in particular), study foam kinetics and conduct air release experiments.”
The automated procedure used to run the new foam testing apparatus makes it possible to rapidly and unequivocally determine the influence of instrumental configuration and design in the determination of foam height and foaming tendencies. Mendez adds, “The new test procedure can evaluate the material and shapes of gas diffusers and determine objectively possible correlations between pore sizes and foam production.”
The new foam testing apparatus provides the user with an advantageous environment for studying and accurately measuring foam. Mendez says, “We have found that foam heights and temperatures can be measured with an uncertainty of +/- 0.25 milliliter of foam and a temperature uncertainty of +/- 0.1 C.”
Mendez has the expectation that this new technique can be adapted to observe online performance of lubricant base stocks and finished lubricant formulations.
The future
Livingstone says, “Change is imminent in the lubricant industry as we are seeing integration of traditional laboratory analyzes merged with data produced from online sensorics and incorporated into an Industrial Internet of Things (IIOT) network. Oil analysis in the future might not just be for assessing the health of the lubricant or a specific component but may play an integral role in optimizing manufacturing processes and remote monitoring of plants.”
An IIOT network enables sensors, actuators and other devices to become interconnected leading to the more rapid sharing and analysis of data. The objective of this network is to enhance manufacturing and industrial processes.
Deepak agrees and goes further by indicating that IIOT can be linked with Industry 4.0, which involves the use of artificial intelligence to enable the machines used in a production plant to interact through wireless connectivity and sensors as a means to optimize the manufacturing process. He says, “Industry 4.0 will revolutionize the lubricant condition monitoring business. IIOT with sensor enablement, mixed reality for data visualization and machine learning for big data will help in creating digital twins of lubricants deployed in the field. These digital twins are the representative lubricant conditions in the field that can be accessed remotely to optimize the performance of machines. Industry 4.0 will transform the conventional business models, for example, uptime of machines will be the value proposition offered by companies associated with condition monitoring.”
Mendez is optimistic about the future of condition monitoring. He says, “Since the global lubricant industry spends a large amount of time and money in corrective maintenance and lubricant reposition, the future is very bright for improvements toward objectiveness, precision and performance of methods for lubricant condition monitoring.”
Toms says, “In general, industry would like more on-equipment sensors for lubricant and machinery monitoring. Wear debris analysis utilizing on-equipment (inline) sensors has been available for over 25 years with over 500 million hours in aviation, power generation, wind turbine and marine applications.”
Customers using inductive wear debris sensors would like lubricant monitoring sensors incorporated into one package to eliminate the need for manual oil condition sampling. However, it is difficult to find a reliable, repeatable lubricant condition sensor that can monitor all the lubricant parameters of interest for different applications. Typically, lubricant condition/contamination [water, fuel, degradation, viscosity, particle counts (cleanliness) etc.] sensors detect one parameter where numerous oil condition and contamination parameters are required. Multiple lubricant condition sensors are probably necessary (
6). In addition, they often require cleaning and/or replacement components. Numerous research and trial projects are working on this topic (
7, 8).
Poley believes the future of fluid analysis and condition monitoring of lubricants and machinery is highly encouraging.
“Test instrumentation continues to make great strides with onsite analysis enabling users to gain faster access to data to improve timeliness of warnings and encourage involvement of maintenance in advisory construction,” Poley says. Another mitigated issue is that improved testing techniques have led to the reduction of sample sizes leading to reduced disposability of chemicals used in the analyzes. Onsite fluid analysis testing is now able to quickly assist in vetting a sensor alarm in at most a couple of hours, depending upon installation logistics versus days when testing was confined to offsite labs.”
Poley predicts that eventually onsite analysis installations will accelerate the movement to the possibility of all-sensor asset condition monitoring (ACM), which is the real time Holy Grail of ACM. He says, “Artificial intelligence-infused intelligence agents are on the threshold, indeed a few already exist, as the primary data evaluators based on the sheer complexity of the evaluation process in the 21st Century. Data will continue to be more varied and more proliferated when multiple condition monitoring disciplines are amalgamated (especially when sensors are in play). Artificial intelligence will be needed to provide the adaptability required to independently assess the importance of the results in order to instantly conduct problem solving of the complex issues facing lubricant systems.”
Condition monitoring has assumed an important role in ensuring that lubricants and machinery can continue to be used over the long term. Technology advancements are enabling users to start working with online techniques and even envision the future use of Artificial Intelligence.
These steps will further improve the accuracy, precision and speed at which condition monitoring can provide users with vital information about lubricant systems and machinery in the future.
REFERENCES
1.
ASTM D8182-18, Standard Test Method for Alloy Classification of Wear Debris Using Laser-Induced Breakdown Spectroscopy (LIBS).
2.
Hill, L., Lawrence, R., Toms, A., “A New Approach to Elemental and Wear Debris Analysis,” Presented at the STLE Annual Meeting in Las Vegas, Nev., on May 18, 2016.
3.
Jean, M., Dupuis, R. and Daviault, S., “Alternative Oil Wear Debris Analysis Method for Aero Engine,” Presented at the STLE Tribology Frontiers Conference in Chicago, Ill., on Oct. 29, 2018.
4.
Poley, J. (2019),
Practical Fluid Analysis in the 21st Century,”
Reliabilityweb.com, ISBN-13: 978-1941872901.
5.
Ayala, J., Bolgioni, D. and Skulic, N. (2019), “Foam Testing Apparatus, U.S. Patent 10,241,103 B2.
6.
Staniewski, G., Wooton, D. and Camilli, N. (2018), “Investigation of Oil Analysis Technology for Online Monitoring,” EPRI: 3002012916.
7.
Suresh, P. and Sosnovski, O., “Fluorescence Spectroscopy for Online Condition Monitoring of Machinery Lubricants,” Presented at the STLE Annual Meeting in Nashville, Tenn., on May 23, 2019.
8.
Sosnovski, O., Suresh, P, Dudelzak, A. and Green, B. (2018), “Fluorescence excitation-emission spectroscopy for degradation monitoring of machinery lubricants,” SPIE, DOI: 10.1117/12.2290637.
Neil Canter heads his own consulting company, Chemical Solutions, in Willow Grove, Pa. You can reach him at neilcanter@comcast.net.