Fundamentals of wind turbines
Jane Marie Andrew, Contributing Editor | TLT Webinars August 2019
Global capacity has grown continuously since 2001, including a 9% increase in 2018.
© Can Stock Photo / ssuaphoto
KEY CONCEPTS
•
As an industry, wind energy is growing fast; both total capacity and individual turbine output have increased steadily over the last decade.
•
The wind characteristics change with geographical location, terrain, season, height, direction and time of day.
•
The power output of a turbine depends primarily on the blade length and the wind speed.
MEET THE PRESENTER
This article is based on a Webinar originally presented by STLE Education on Feb. 27.
Fundamentals of Wind Turbines is available at
www.stle.org: $39 to STLE members, $59 for all others.
Dr. Harpal Singh is a senior scientist at Sentient Science where he is engaged in wind turbine and aerospace-related mechanical and materials science research involving tribology, materials characterization and failure analysis.
Singh has more than six years of experience in the field of tribology and metallic materials. He holds a patent, several peer-reviewed publications and two best paper awards from STLE in the field of solid lubricants. He earned his doctorate in mechanical engineering from the University of Akron, Ohio. His research was focused on the mechanical, material and tribological properties of materials and coatings used in wind, automotive and aerospace applications. His expertise includes materials characterization, tribological testing, coatings and failure analysis.
You can reach Singh at
hsingh@SentientScience.com.
 Dr. Harpal Singh
The rising concerns over climate change, environmental pollution and energy security have increased interest in developing renewable energy. We are seeing unparalleled enthusiasm, demand and growth in renewable energy production, with wind energy being at the forefront. Wind energy is expanding both onshore and offshore with bigger, more powerful turbines, creating new demands and markets.
Market
The global capacity for generating power from wind energy has grown continuously since 2001, reaching 591 GW in 2018 (9% growth compared to 2017), according to the Global Wind Energy Council (
1).
In the U.S., capacity figures are reported by the American Wind Energy Association (
2). According to this trade association, the total wind power capacity in the U.S. was 96,488 MW at the end of 2018, an 8% increase from the 88,964 MW installed at the end of 2017 (
see Figure 1). (Generation capacity means the output of a wind turbine when running at rated power.) New installed capacity grew steadily from 2000 to 2012. After a spike and a trough in 2012 and 2013, new installations recovered in 2014 and have leveled out at about 7,000-8,500 MW annually since 2015.
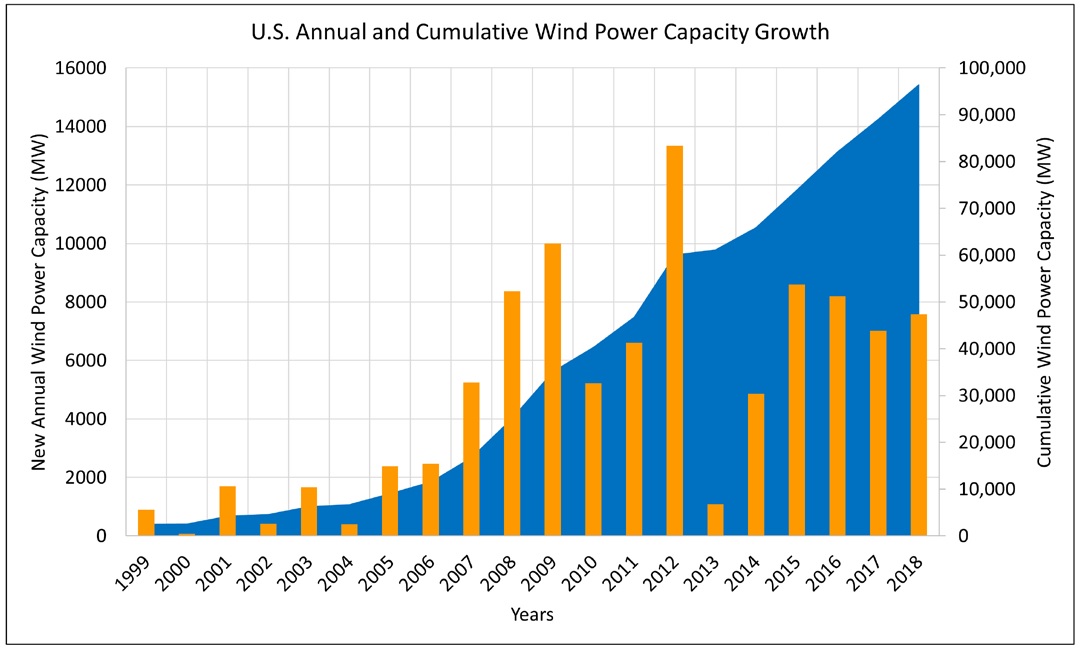 Figure 1. Trends in U.S. wind energy growth. (Figure courtesy of the American Wind Energy Association’s U.S. Wind Industry Fourth Quarter 2018 Market Report.)
Capacity growth in the U.S. in 2018 was concentrated in the central states (the "wind belt”), the West Coast states and, to a lesser extent, the tier of states along the northern border. Texas leads in overall installed capacity, followed by Oklahoma and Iowa. Similar trends are observed in new capacity installations, with Texas far outstripping any other state, followed at a distant second by Iowa (
see Figure 2). Five central states were in the next tier in 2018: Colorado, Oklahoma, Nebraska, Kansas and Illinois. This growth has resulted in strong employment growth. In the decade from 2008 to 2018, the number of full-time equivalent jobs in the wind industry grew from about 50,000 to more than 110,000. Texas has the most wind-related employment, with 25,000-26,000 jobs, distantly followed by 10 other states with 3,000-10,000 jobs by the end of 2018.
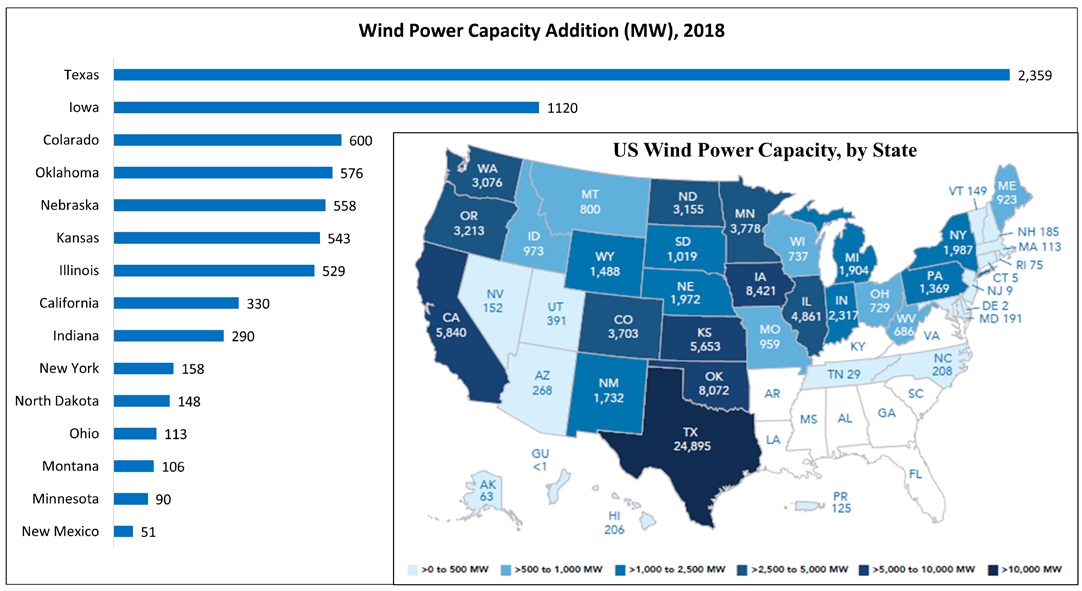 Figure 2. New U.S. capacity installed in 2018 and (inset) cumulative installed capacity by state. (Figure courtesy of the American Wind Energy Association’s U.S. Wind Industry Fourth Quarter 2018 Market Report.)
In addition to exploiting interior wind belt regions, many countries with ocean coastlines are developing offshore wind power generation. The trends in offshore capacity mirror those for land-based capacity, showing steady growth. The global offshore capacity as of 2018 was 23,140 MW or about 4% of the global 2018 capacity of 591 GW, according to the Global Wind Energy Council (
1).
The cost of onshore wind energy has become competitive with utility-scale solar photovoltaics and gas combined-cycle generation joining them as the three least expensive sources of energy. According to Lazard, a financial advisory and asset management firm, the cost of wind energy dropped 69% from 2009 to 2018, and the mean levelized cost of energy for wind power is now $29 to $56 per megawatt-hour (
3). Coal is the only other technology that approaches the same range.
In a growing trend, large corporations are including wind power in their power purchase strategy, either through direct ownership of wind projects or purchase agreements. Among commercial and industrial (C&I) purchasers, Walmart made an early mark in this area with a purchase announced in 2008. Google Energy has announced purchases each year since 2010 and is currently the largest C&I wind customer, with total contracted capacity of 1,096 MW. AT&T contracted the most new wind power in 2018, a total of 820 MW (
2). Other major purchasers include not only large technology companies and manufacturers but also a municipality, a regional transit system and a government agency.
As the market has grown, turbine models have proliferated; in 2018 there were more than 30. According to the American Wind Energy Association, three manufacturers hold over 85% of the U.S. market: GE Renewable Energy (41.4%), Vestas (24.2%) and Siemens Gamesa Renewable Energy (19.7%). Smaller players are Mitsubishi, Suzlon, Clipper and Senvion. In terms of capacity, GE Renewable Energy and Vestas are the clear leaders at 39,912 and 23,318 MW, respectively (
2).
The products created by these companies are growing ever larger in both generating capacity and physical size. For turbines installed in the U.S. from 2000 to 2018, average generating capacity roughly quadrupled from 660 kW to 2.43 MW. For a sense of scale, the average U.S. household uses 2 kW of electricity annually. A 2.5-MW turbine running at peak capacity all year round would power about 1,250 homes.
In the same period, the average height of the turbine hub increased from 190 feet (58 m) to 288 feet (88 m)—approaching the height of the Statue of Liberty—and rotor diameter has more than doubled from 160 feet (49 m) to 380 feet (116 m), about the length of a soccer field. The majority of turbines installed in the U.S. in 2018 had capacity ratings in the range of 2-3 MW, followed by units rated for 3-3.5 MW. Sixteen models dominated the 2018 installations, as shown in Figure 3.
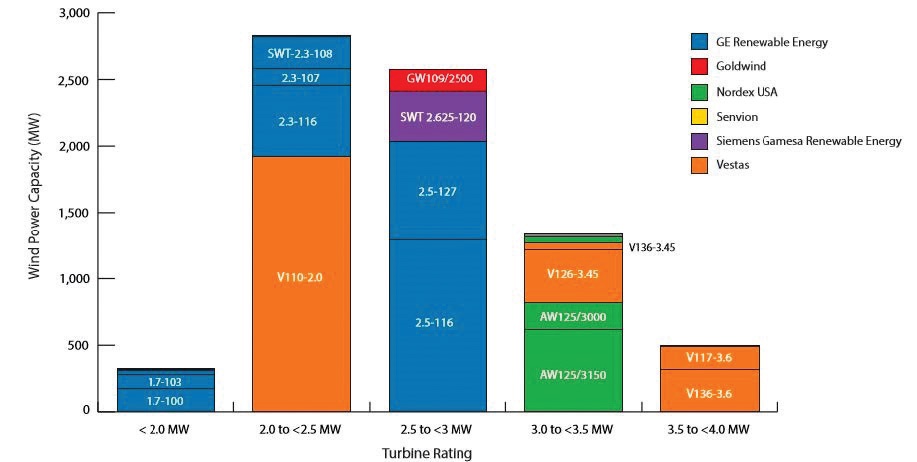 Figure 3. Turbine models installed in 2018. (Figure courtesy of the American Wind Energy Association’s U.S. Wind Industry Fourth Quarter 2018 Market Report.)
Wind physics fundamentals
Figure 3. Turbine models installed in 2018. (Figure courtesy of the American Wind Energy Association’s U.S. Wind Industry Fourth Quarter 2018 Market Report.)
Wind physics fundamentals
Wind arises from processes driven by solar energy. The sun’s energy creates temperature differences that drive air circulation. Hot air rises, reducing the local atmospheric pressure; nearby cooler air flows into this region of lower pressure; this air flow is wind.
Wind is shaped by both global and local forces. Global patterns are in part the result of the Coriolis force, which arises from the Earth’s rotation. As cool air flows from higher to lower pressure areas, it is deflected by the Coriolis force; the direction of deflection depends on latitude. As a result, different regions of Earth have different prevailing wind directions.
At the other end of the spectrum, local geographical features can have very specific effects. One such effect, familiar to anyone living near the ocean, is the land breeze. At night, the water is warm relative to the land, so air is warmed over the water and rises; the resulting low pressure draws cool air from land out to sea: the land breeze.
Although there may be a
prevailing wind direction, it is not the
only wind direction. Both direction and speed are highly variable with geographical location, season, height above the surface and time of day. Understanding this variability is key to siting wind power generation, because higher wind speeds mean higher duty cycles (i.e., longer periods of active power generation). It is necessary to measure the characteristics of the wind in great detail, including how often winds of certain speeds occur (
see Figure 4) and how the surrounding terrain affects the stability of wind flow.
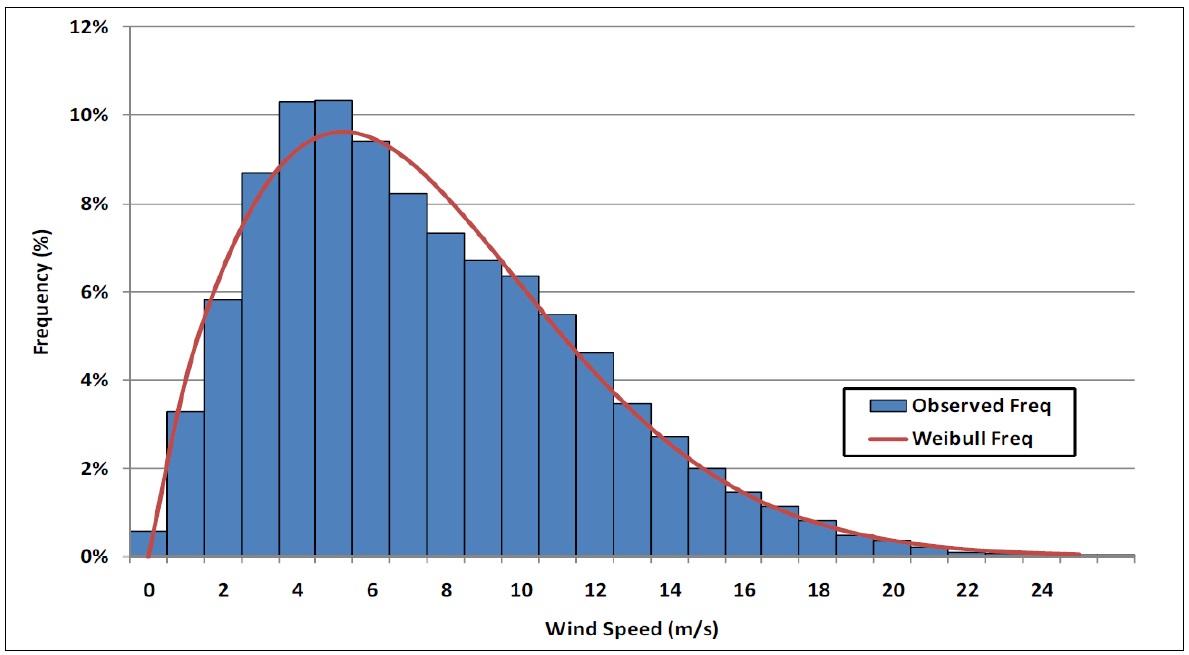 Figure 4. Plot of the frequency of occurrence of different wind speeds over a period of a year. (Figure courtesy of Sentient Science Corp.)
A stable flow with a consistent speed is very important for both generating efficiency and structural integrity. Variability leads to wind shear and wake forces. Wind shear is a function of wind speed, which increases with height above the surface. Thus, the shear forces on the rotor blade are greater when it is in the top position (
see Technical Note: Equations for Wind Turbines).
Technical note: Equations for wind turbines
Wind Shear
An important consideration for turbine siting and operation is wind shear when the blade is at the top position. Wind shear is calculated as
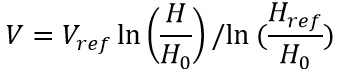 V
V = wind speed at height
H above ground level
Vref = reference speed
Href = reference height
H = height above ground level for the desired velocity,
V
H0 = roughness length in the current wind direction.
For instance, assume we know that the wind is blowing at 8 m/s at a height of 20 m. We want to calculate the wind speed at 70 m. If the roughness length is 0.1 m, then
Vref = 8
H = 70
H0 = 0.1 and
Href = 20, hence,
V = 8 ln(70/0.1) / ln(20/0.1) = 9.8915 m/s.
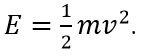
Turbine Power
The energy contained in a mass
m of moving air with velocity
v is
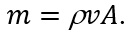
The mass flow rate of moving air with a density
ρ through a cross-section area
A is
The power contained in a flowing mass of air through area
A is
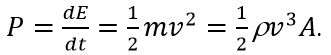
The power extracted by blades of diameter
d is
where the power coefficient
cp has a theoretical limit of ~0.6; this is referred to as the Betz limit, which defines the maximum amount of wind kinetic energy that can be converted to kinetic energy.
Wake forces are created because the wind slows down and becomes turbulent as it passes the wind turbine rotor blades. This is why turbines are widely spaced, usually five to nine rotor diameters in the direction of the prevailing wind and three to five rotor diameters in the perpendicular direction.
Wind speed also changes as a result of turbulence, which can be caused by nearby rough terrain, including trees and buildings; these can cause wind speed to vary greatly even within several hundred yards or meters. This effect, called turbulence, decreases efficiency and causes fatigue loading.
Wind power fundamentals
Energy is captured from wind through the lift phenomenon—the same phenomenon that allows birds and airplanes to fly. (Turbine blades are, in essence, captive wings.) The lift generated as wind passes over the blade causes it to move, thereby rotating the main shaft. The rotation is transmitted through a gearbox to a generator, which converts it into electricity. The magnitudes of the lift and drag on the turbine blade are dependent on the angle of attack between the apparent wind direction and the chord line of the blade.
Several different factors influence the power output of a wind turbine. Among other factors, wind speed and rotor diameter are the two primary parameters (
see Technical Note: Equations for Wind Turbines).
•
Turbine power increases with the square of blade length. For example, increasing the rotor diameter from 262 feet (80 m) to 394 feet (120 m) allows power to increase from 2 MW to 5 MW (a factor of 2.5).
•
Turbine power increases with the cube of wind velocity. For example, a turbine at a site with an average wind speed of 16 mph would produce 50% more electricity than the same turbine at a site with average wind speeds of 14 mph.
These two fundamental physical relationships are behind the drive to scale up the physical size of turbines. A larger rotor diameter allows a single turbine to generate more electricity, providing better return on installation cost. And because wind speed and consistency both increase with height, taller turbines produce a higher and more consistent supply of electricity.
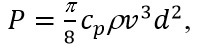
A given design operates with a range of wind speeds. Below the cut-in wind speed, the turbine cannot produce power because the wind does not transmit enough energy to overcome the friction in the drivetrain. At the rated output wind speed, the turbine produces its peak power (its rated power). At the cut-out wind speed, the turbine must be stopped to prevent damage. A typical power profile for wind speed is shown in Figure 5.
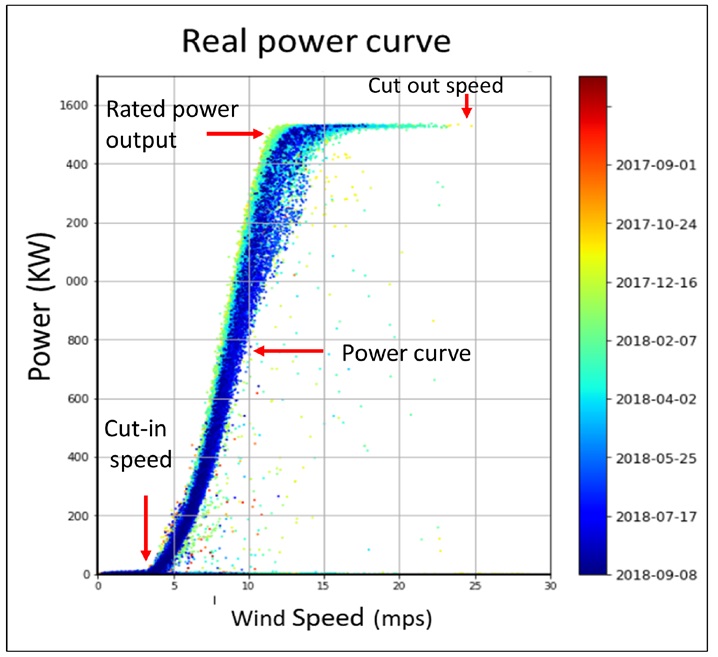 Figure 5. Profile of power output from a wind turbine over a year. (Figure courtesy of Sentient Science Corp.)
In addition to an operating range, an installed turbine has a capacity factor that reflects its actual power generation. The capacity factor is the annual average of power generated divided by the rated peak power. For example, if a turbine rated at 5 MW produces power at an average of 2 MW, then its capacity factor is 40%. In general, a higher capacity factor is preferred, although it may not be advantageous economically. For instance, in a windy location, it will be advantageous to use a large-size generator with the same rotor diameter. This would tend to lower the capacity factor, but it will lead to substantially larger annual production.
Wind turbine technology
Turbines come in several general categories based on orientation and drivetrain type.
The turbine blades can be oriented around either a vertical or horizontal axis. An advantage of the vertical axis is that blades do not have to be mechanically reoriented when the wind direction changes. Horizontal-axis turbines come in two general designs. In a downwind design, the blades face away from the incoming wind; in an upwind design, the blades face into the wind (
see Figure 6). More than 90% of currently installed turbines are of the upwind type, as this design does not create wind shade behind the tower.
For the drivetrain, in a gearbox-drive design, a gearbox is used to increase the speed transmitted from the rotors to the generator. In a direct-drive design, the speed is transmitted directly to an annular generator. Aside from the gearbox, the components are generally similar; however, in a direct-drive turbine the generator diameter is much bigger to increase generator torque as it rotates at the same speed as the turbine blades.
 Figure 6. Simplified view of components of an upwind-facing, horizontal-axis wind turbine with a gearbox drive. An animation is available (4). (Figure courtesy of Union of Concerned Scientists, www.ucsusa.org.)
The wind turbine components that experience friction and wear and require lubrication are the following:
•
Pitch bearing (grease)
•
Main shaft bearing (grease)
•
Gearbox if any (oil)
•
Yaw drive (grease)
•
Generator bearing (grease).
The pitch drive is used to adjust the angle of the blades. This adjustment is made for two reasons: 1.) to capture maximum power from winds below the rated output wind speed or 2.) to slow the blades for safe operation at winds above the rated speed. The yaw drive moves the blade and housing assembly (the nacelle) to the optimum wind direction in relation to the wind. An animation prepared by the Union of Concerned Scientists is helpful in visualizing the action of these drives (
4).
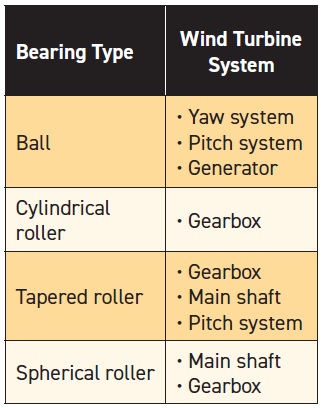
Figure 7 shows a typical three-stage wind turbine gearbox. A planetary stage (bottom left) transfers the torque first to a low-speed intermediate stage (bottom right) and then to a high-speed intermediate stage (middle), which drives a high-speed stage (top) that feeds the generator. Such a design might, for example, convert 14 RPM input from the rotors into 1,500 RPM to the generator; the exact conversion of course depends on the gear ratio. Different bearing types are used in these various components, as shown in Table 1.
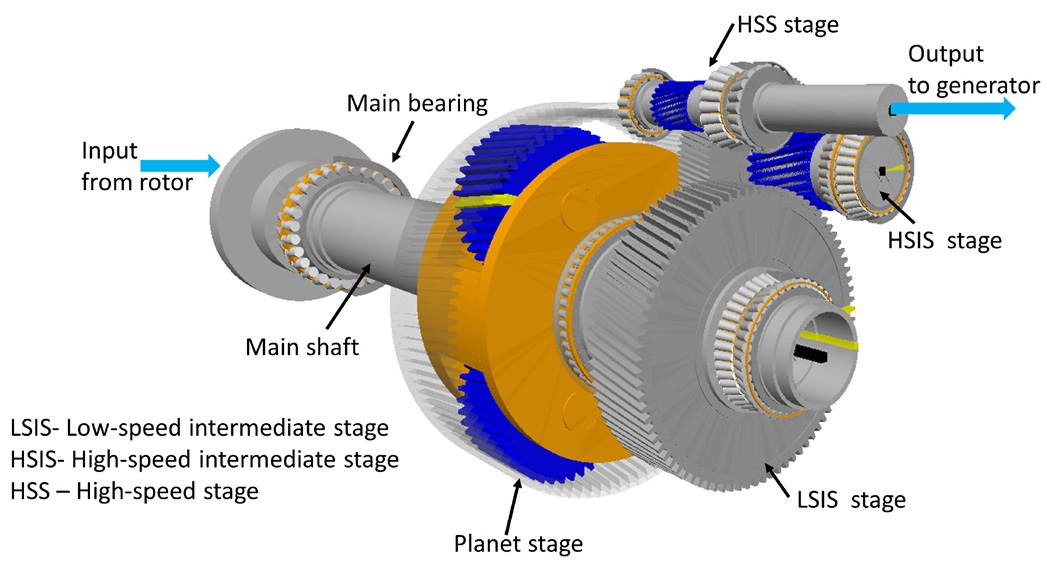 Figure 7. Power flow diagram of a typical three-stage wind turbine gearbox. The low-speed input from the rotors (far left) is converted into high speed at the output shaft (HSS) to feed the generator (top right). (Figure courtesy of Sentient Science Corp.)
Table 1. Application of Different Bearing Types in Wind Turbine Drivetrains
Figure 7. Power flow diagram of a typical three-stage wind turbine gearbox. The low-speed input from the rotors (far left) is converted into high speed at the output shaft (HSS) to feed the generator (top right). (Figure courtesy of Sentient Science Corp.)
Table 1. Application of Different Bearing Types in Wind Turbine Drivetrains
Some technical differences should be noted between land-based and offshore turbines. Offshore installations account for more than 3% of global capacity. Offshore construction presents different challenges, the most obvious being how the structure is anchored. The strategy differs depending on the water depth. For depths less than about 100 ft (30 m), monopile construction is used. For transitional waters (100-200 ft or 30-60 m), a cross-braced “jacket” foundation is used. For deeper waters, prototype floating platforms are being tested. The transformer design also is different for different water depths, and in general offshore installations are moving from gearbox to direct-drive designs.
Another very significant difference is size. Without the need to limit noise or accommodate terrain-induced turbulence, designers can pursue truly giant scales. GE has built an offshore design rated at 12 MW, significantly higher than the 2017 average of about 2.3 MW. It is indeed a giant: the rotor diameter is on the scale of the towers of the Golden Gate Bridge, and the surface area of the blade sweep is equivalent to seven American football fields. This is a direct drive design where speed is transmitted directly to the generator. Why build such giants? In addition to raising power output, large turbines reduce installation cost. Installing one 12-MW turbine is cheaper than installing six 2-MW ones; thus the final cost per megawatt is lower. For these reasons, and because of the abundance of offshore wind resources, the industry is moving to an emphasis on offshore wind power.
Summary
Wind turbines are the fastest-growing renewable energy source, and wind energy is now cost-competitive with nonrenewable resources. Growth in generating capacity is concentrated in five to 10 states, notably Texas. The field of turbine manufacturers is crowded, but GE Renewable Energy and Vestas are leaders in the U.S. wind market. Increasingly, capacity is being purchased by entities other than utilities, and offshore installations are becoming more attractive and viable.
In terms of technology, turbine design focuses on optimizing power output by focusing on two key parameters: blade length and average wind speed. The latter is affected by surface terrain and varies spatially, directionally and seasonally. The effectiveness of a particular installation is quantified by a capacity factor: the ratio of actual annual energy output to the theoretical maximum output. A number of basic designs are in use, but most commercial installations use a horizontal axis, upwind-facing design. Turbines are becoming ever larger, in both physical size and generating capacity, in order to capture more stable winds and to maximize return on installation costs.
REFERENCES
1.
Global Wind Report 2018, by Global Wind Energy Council. Available
here.
2.
U.S. Wind Industry Fourth Quarter 2018 Market Report by American Wind Energy Association, January 30, 2019; public version available
here.
3.
Lazard’s Levelized Cost of Energy Analysis – Version 12 by Lazard, 2018, pp. 4 and 8. Available
here.
4.
How Wind Energy Works,” by the Union of Concerned Scientists. Available
here.
Jane Marie Andrew is a free-lance science writer and editor based in the Chicago area. You can contact her at jane@janemarieandrew.com.