Liberating oil analysis data
Jeanna Van Rensselar, Senior Feature Writer | TLT Feature Article July 2018
Budget, personnel and training issues often prevent end-users from getting more from their lab reports.

© Can Stock Photo / alexeys
KEY CONCEPTS
•
End-users often collect oil analysis data that is never analyzed or acted upon.
•
Often factors beyond their control prevent end-users from getting the most from their oil analysis programs.
•
Some oil analysis reports are too complicated for even fleet managers to understand.
With oil analysis, an extensive amount of data is collected and not always used. Oil analysis labs use elemental analysis, particle analysis and many other chemical tests to keep plants on top of what is going on with their industrial lubricants and metalworking fluids.
Brian Thorp, PdM Tech III, CLS, MLA III, of Seminole Electric Cooperative Inc. in Palatka, Fla., says, “The obvious reason we apply used oil analysis at Seminole Electric is to monitor the health of the lubricant and the equipment. As the program matured, it was used to identify repeat problems, which were corrected. Some of the items that were corrected included changing viscosity, better filtration, coolers or heaters, better breathers and better seals.”
Seminole Electric’s predictive maintenance program has been in place for almost 20 years. The program utilizes multiple technologies, so once something is identified it can be confirmed with another technology. “As with any business, sometimes things are fixed, other times they are monitored until they can be fixed or until just before they fail, and some are run to failure,” Thorp says.
As with Seminole, using the data from oil analysis reports can predict and prevent failures before they happen (
see How to Interpret an Oil Analysis Report in Five Minutes or Less). Also, following up on recommended actions can be a significant time and cost savings.
So why aren’t end-users taking better advantage of this information? There are three primary reasons:
1.
They don’t understand what the data contains.
2.
They are dealing with budget restrictions.
3.
The data is not in a form that they can readily use.
How to interpret an oil analysis report in five minutes or less
The fact is, most fleet managers and even oil analysis program champions don’t have all day to scrutinize oil analysis reports. While spending 10 minutes on each report may seem like a worthwhile endeavor to the oil analysis lab, to the fleet manager this may mean skipping lunch. So here’s how to hit the highlights in somewhere between one and five minutes:
1.
Verify the oil and machine type.
2.
Check the viscosity.
3.
Compare elemental wear to reference/trend.
4.
Review elemental contamination data/particle counts and compare with reference/trend.
5.
Check moisture levels and compare to reference/trend.
6.
Review acid and base numbers and compare to reference/trend.
7.
Check remaining data such as flash point, oxidation levels and demulsibility.
8.
Go back and note anything that is trending toward
unacceptable or is significantly out of reference range.
Mike Roth, CMRP, operations manager, Metal Control & Casting, for Olin Brass in East Alton, Ill., explains, “Typically we are looking at the basics of the oil analysis, such as water content, viscosity, acid number, particle contamination and other basic out-of-normal parameters. For each type of oil, we focus on the same basic parameters but we also focus on specific parameters for each oil type and use as well. For example, when we review gear oil analysis, we look at wear particles, the size of those particles and additives levels.
“We also pay special attention to the history of the oil analysis,” Roth adds. “If we have a system that typically has high wear from a bronze gear, we are not too concerned with the existence of copper particles. However, if we have a system that normally does not show copper, then the appearance of copper could be indicating wear on a bronze bearing cage. We use oil analysis for maintaining fire-resistant fluids, hydraulic fluids, motor bearing oil systems, Morgoil bearing systems and gear oil systems.”
Reason No. 1: Poor or no understanding
Plant managers have to deal with an overwhelming amount of data; oil analysis is just one of many sources. Many if not most plant managers do not have time to examine oil analysis reports, prescribe actions and follow up.
The good news is that there are two sources of help for this: the lubricant supplier and the oil analysis lab. Both should have the expertise to devise a streamlined approach for reviewing reports. Also, most of today’s oil analysis labs use software that not only improves the quality of the reports but makes data easier to read and interpret.
David Godwin, industrial sales representative for Engineered Lubricants Co. in St. Louis, Mo., says, “There is an absolute correlation between how much advice and support we offer our customers and the success of their oil analysis program. Our employees have to somewhat be salespeople to communicate persuasively the potential for observed problems in used fluid data. Having multiple overlapping methods that confirm problems and repeatability of tests—and especially observing trends in multiple samples from the same system—can save the customer much unplanned down time and minimize maintenance costs (
see The Six Tests David Godwin Recommends).”
The six tests David Godwin recommends
David Godwin, industrial sales representative for Engineered Lubricants Co. in St. Louis, Mo., recommends the following six oil analysis tests but cautions that determining which tests to recommend depends on the type of fluid, risks associated to the machine or personnel and degree of contamination anticipated.
1.
Gravimetric. This draws the fluid sample, often pre-diluted with a solvent, through a media of different types and micron ratings; the selection is dependent on type of fluid or volume of contamination expected and size of particulate through the media; it then is dried and weighed. Further analysis can be done by observation under magnification to determine particulate composition, size shape, etc. This testing is common for heavily contaminated fluids such as used metalworking fluids or engine oils (
see Figure 1).
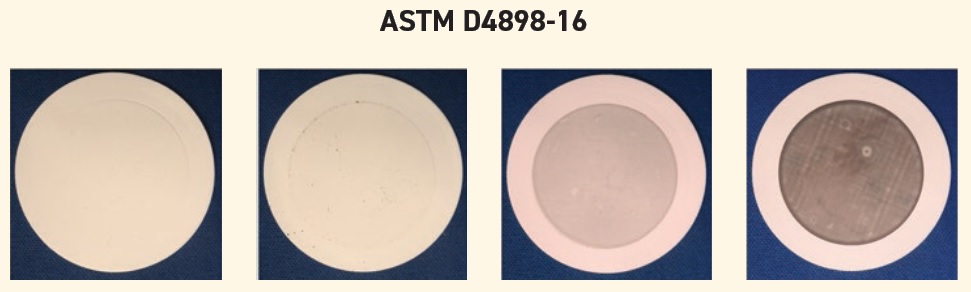 Figure 1. Sample report: ASTM D4898-16: Gravimetric analysis for insoluble contamination of hydraulic fluids. (Figure courtesy of Engineered Lubricants Co.)
2.
Direct read ferrography. This is a statistical method of classifying particulate in a sample as either large or small. The proportion of large to small particulate in the sample can be very valuable, especially when comparing it with a trend of multiple samples collected from the same system to observe if the proportion is changing with each sample. The large-to-small particle ratio is indicative of the rate at which a machine is wearing and generating large particulate (
see Figure 2).
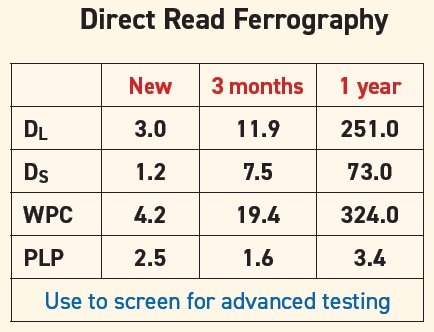 Figure 2. Sample report: Direct read ferrography report. (Figure courtesy of Engineered Lubricants Co.)
3.
Light extinction particle counting. This can detect and quantify particulate in various size ranges according to multiple standards such as NAS, SAE, CM or ISO. This can be used to determine particulate load by varying size ranges and make assessments on filtration efficiency or operation. This is a common test for hydraulic oils, gear oils, engine oils, etc.
4.
Ferrography. This is a study of particulate debris in a fluid sample and can define various failure or wear modes. Its predictive ability on wear of the machine is incomparable for detecting wear modes and problems early so repairs can be made long before catastrophic failures occur. This is used more for critical systems such as engine oils and hydraulics with servo controls, air compressors that must operate reliably, turbines, etc.
5.
Automated optical. This uses a computer-controlled microscope that can observe particulate captured on a filter like the gravimetric media and discriminate particulate types in order to focus on certain particulate such as wear debris only, not external contaminants, etc. Data is provided with much statistical support, classification of particulate in ISO codes and dimension of the 10 largest particles (
see Figure 3).
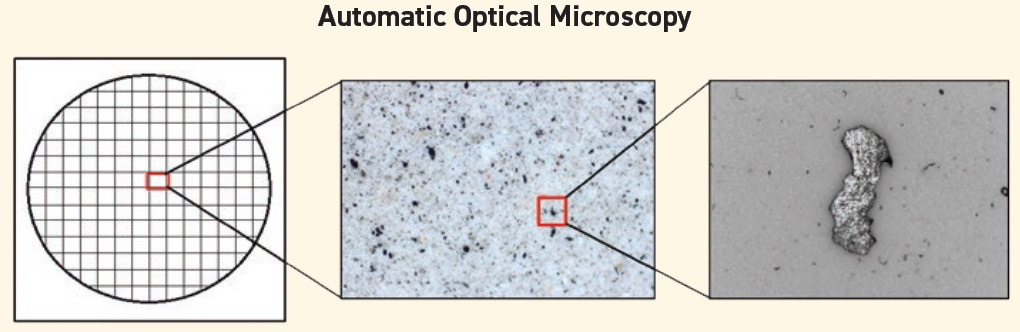 Figure 3. Sample report: Automatic microscopy report. (Figure courtesy of Engineered Lubricants Co.)
6.
Scanning electron microscope. This can analyze particulate on a ferrogram slide or gravimetric filter and identify size and composition of wear debris.
Godwin adds: “Minor corrective actions can be taken early on. Customers follow a good regular frequency on sampling and monitoring and avoid excess consumption (they don’t have to drain systems still in good working order) and proven reliability in their operations.”
Mike Roth, CMRP, operations manager, Metal Control & Casting, for Olin Brass in East Alton, Ill., concurs. “While many people will tell you not to mix lubricant supply and laboratory testing, I have found a good synergy can exist when you are developing special application lubricants,” he says. “We have had an excellent partner who not only supplies the lubricant but also the lubrication analysis. When we have had problems, our supplier has worked tirelessly to identify the problem and assist us with solving it.”
Mike Johnson, principal consultant for AMRRI in Franklin, Tenn., believes the usefulness of oil analysis data is often dependent on the knowledge and skill level of the person who is fielding the information and generating actionable items. “Oftentimes the corrective responses revolve around applying a band-aid to address the symptom because the actual cure is outside immediate reach for various reasons,” he says. “The lab often pushes but can only make generalized suggestions for action based on the relative importance of the information provided.”
All maintenance personnel should have a basic understanding of oil analysis and one person should be designated the champion—someone who will take the lead. Having someone at the end-user’s organization (trained and possibly certified) who can accurately interpret the report is a key for success (
see The Perfect World Versus the Real World of Oil Analysis).
The perfect world versus the real world of oil analysis*
In a perfect world, the end-user would have a comprehensive oil analysis program in place, follow sampling protocol to the letter, read the full report and follow through on the recommendations. In a perfect world, the lab would help the customer design the oil analysis program, suggest sampling protocol that is in line with budget and needs and produce timely reports that are easy to understand. On the surface the whole process seems straightforward: select the equipment, take the sample, send it to the lab and wait for results. In the real world:
•
Equipment selection is random and based on what one person thinks should be tested.
•
Samples are taken from the locations with the easiest access, not from where they best represent the oil in use.
•
Samples sit around for several days before anyone sends them to the lab.
•
The lab doesn’t process the sample in a timely fashion.
•
The lab report is formatted in a way that assumes customers have a background in statistics.
•
The lab report is irrelevant because either no one reads it thoroughly or it doesn’t get read at all.
•
No one follows through on obvious action items.
*Van Rensselar, J. (2012), “Maximizing the Benefits of Fluid Analysis,” TLT,
68 (7), pp. 30-39.
“There has to be a champion of the program to truly become involved with oil analysis,” Thorp says. “You can’t just read the manager’s report on the front page and get all the information from the reports. The front page gives you an overall idea of condition, but to be able to spot problems and perform condition-based oil changes you must understand the results, watch trends and—most of all—know what additional tests need to be performed to provide the information you need. If you don’t ask the right questions, it’s hard to get the right answers.”
Skill training and certification are essential. Many OEMs and lubricant manufacturers offer training and certification for their products and services. Most oil analysis labs also offer training on their products and services and are typically the best equipped to help end-users understand the data. In addition, lubricant training is available from STLE, including certifications for the Certified Lubrication Specialist™ (CLS) and Certified Oil Monitoring Analyst I™ and II™ (OMA I and II) (
1).
“I think it is extremely important to have a good relationship with the lab, your lubricant supplier and as many other industry professionals as you can,” Thorp says. “There can never be too many people to get knowledgeable advice from when it is needed. These resources can be invaluable when you know something is not right, but none of the normal tests are identifying the problem. This is when it is very important to have people who understand the strengths and weaknesses of oil analysis tests, as they may be able to suggest another test that might identify the problem.”
Reason No. 2: Budget restrictions
The budgets for some organizations—particularly smaller organizations—do not factor in a plant maintenance position. In fact, during hard times the maintenance position is often the first cut. Many companies have realized the actual cost of eliminating this position, but certainly not all. Reducing unplanned down time can more than make up for the salary of this position; having a champion dedicated to carrying out the recommended actions from oil analysis can produce significant savings.
Thorp says, “Implementing condition-based oil changes on most of the equipment being monitored is an easy way to save big money. Most people mainly think of the lubricant cost, but when you factor in the real cost—receiving, storing, dispensing, installing, disposal and labor—the real cost can average four to seven times the cost per gallon."
Many industrial plants are downsizing personnel and outsourcing maintenance activities. For example, some predictive maintenance teams that once had four to six people have been cut in half (
2). The reality today is that nearly all organizations, regardless of revenue, are constantly looking to squeeze more from personnel and equipment. One of the ways they do this is through technology. And when it comes to oil analysis, this means software.
However, software, if not carefully developed and implemented, can create an even more unmanageable data glut than traditional oil analysis methodologies.
Johnson explains, “Regrettably, I encounter many sites doing no lubricant-based condition monitoring at all. This is inexplicable. The only reason a facility would neglect lubricant analysis as a mainstay in their machine condition control activities is because the financial managers simply do not understand how much value exists in this activity. Lubricant analysis for condition control purposes is easily worth five times the cost—and, in reality, more like 10 times. Any one of us would dearly love to have a place to park our investment dollars if we would get a five-times return per year, or for that matter, over a three-year period.”
Reason No. 3: Data is not in a usable form
Reports that are difficult for the average person to understand are one thing; reports that are difficult even for fleet managers to understand are another. Most used oil reports go straight to the fleet manager who is responsible for reviewing them, outlining a course of action, assigning actions and following through. In all likelihood, very little beyond reviewing the report occurs.
Why? Because the fleet manager is often overwhelmed by a difficult-to-interpret array of codes and numbers. Even oil analysis laboratory professionals say end-users may find reports frustrating to decipher (
3).
“Over the years I have been involved with six different labs performing our analysis,” Thorp says. “All of the reports have been different in format, but all of the information required has been listed. Some reports have a lot of extra charts, graphs and other things that I have not generally used.”
For others, the reports just need some improvement. Roth says, “We are satisfied with the reporting format. One area that I would like to see improved is the ability to pull up trending information for each specific system. It’s important to develop custom reports and watch parameters for the end-user to utilize in order to quickly and effectively diagnose any problems.”
Johnson adds that there are many reasons customers don’t use the information in the report. “A lack of knowledge about what to do with lab data is likely our biggest impediment,” he says. “We are all too busy and over-tasked to spend the time needed to develop deep knowledge on the topic. I have some customers who are highly effective with their lubricant-based condition monitoring activities, and the common thread with these customers is dedicated resources, which of course follows management recognition that dedicated time and an advanced skill set are highly valuable.”
The bottom line is that whatever is preventing end-users from leveraging their oil analysis programs to the max isn’t always their fault. When fluid analysis programs fail to live up to their expectations the fault usually lies in reports that are nearly impossible for the average person to decipher, budget issues and time constraints and/or reports with recommendations that are difficult to implement.
REFERENCES
1.
From
Efficient Plant Magazine: Do You Have An Effective Lube Oil Analysis Program? Sept. 1, 2005. Available
here.
2.
Ibid.
3.
From
Construction Equipment Magazine: How to Analyze Oil Analysis, Jan. 1, 2006. Available
here.
Jeanna Van Rensselar heads her own communication/public relations firm, Smart PR Communications, in Naperville, Ill. You can reach her at jeanna@smartprcommunications.com.