Coefficient of friction in artificial joints
R. David Whitby | TLT Worldwide January 2018
European research shows results are determined largely by the choice of metal, plastic or ceramic prostheses.
Friction factors were lowest in ceramic bearings, with ceramic on ceramic exhibiting the lowest friction factors in all conditions.
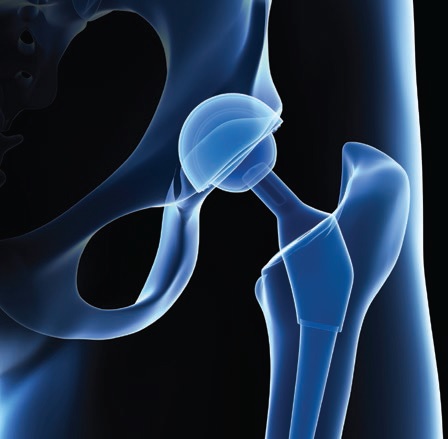
© Can Stock Photo / Eraxion
ARTIFICIAL HIP AND KNEE JOINTS are made in three basic types: (1.) metal-on-metal (MOM), (2.) metal-on-ultra high molecular weight polyethylene (MOP) and (3.) ceramic-on either metal (COM), polyethylene (COP) or ceramic (COC).
The metal components can be titanium, cobalt-chromium alloys or cobalt-mixed metals. For hip joints, the ball is usually made of the first material and the socket is made of the second material. Sometimes the socket is metallic with a liner made of UHMWP. Surgeons use ceramic materials in combination with special metal or plastic components for patients who are allergic to metals. Although ceramic parts are durable, they have been more fragile than metal components, although this is changing.
Ten years ago researchers at the University of Leeds in the UK investigated the friction behavior of different artificial hip joints. Used was a pendulum friction simulator—a servo-hydraulic machine controlled by a PC via a graphic user interface that can apply a dynamic loading cycle similar to that experienced by implants
in vivo. A range of 28-mm-diameter bearings were investigated under different swing-phase loads and lubricated conditions. Lubricants used were distilled water, 25% (w/v) bovine serum (with 0.1% sodium azide) and 100% bovine calf serum.
Friction factors were lowest in the ceramic bearings, with the COC bearing having the lowest friction factor in all conditions. COM bearings also had low friction factors compared with MOM, and the trends were similar to COC bearings for all test conditions. Increasing swing phase load was shown to cause an increase in friction in all tests. Increased serum concentration resulted in increased friction factor in all material combinations, except MOM, where increased serum concentration produced a significant reduction in friction factor.
The mean friction factor for the MOM bearings in 25% serum was 0.12, significantly higher than the other bearing combinations. There was no significant difference found among the other bearing materials, though COC bearings exhibited the lowest friction factors, 0.04. MOP and COP bearings had higher friction factors than COM and COC, though not significantly different, with the MOP exhibiting a higher friction factor than the COP bearing. The COM bearing had a significantly lower friction factor than the MOM bearing, closely matching that of COC bearing, with a mean friction factor of 0.05.
Protein concentration was shown to have a marked effect upon the friction factors of the different bearings. For all material combinations, except MOM, increasing the protein concentration resulted in an increase in friction factor. However, this was only found to be a significant increase for the COC and COM bearings when changing the lubricant from water to 25% serum. The MOM bearings exhibited a statistically significant reduction in friction factor with increasing protein concentration, with a reduction of friction factor from 0.17 in water to 0.10 in 100% serum.
In 2013 researchers at Delft University of Technology in the Netherlands measured in vivo contact forces and friction moments during walking. Instrumented hip joint implants with a ceramic head and a UHMWP inlay were used. The measurements were taken three months post operatively in eight patients. The coefficient of friction was calculated in three dimensions throughout the whole gait cycle.
On average, peak contact forces of 248% of the body weight and peak friction moments of 0.26% body weight times meter were determined. However, contact forces and friction moments varied greatly between individuals. The average coefficient of friction increased during the extension phase of the joint, from 0.04 (0.03-0.06) when pushing off with the toes to 0.06 (0.04-0.08) when heels touched the floor. During the flexion phase, the coefficient of friction increased further to 0.14 (0.09-0.23) when pushing off.
The average friction-induced power throughout the whole gait cycle was 2.3 W (1.4 W-3.8 W). Although parameters in addition to synovial fluid determine the friction, the wide ranges of friction coefficients and power dissipation indicate that the lubricating properties of synovial fluids are individually very different. Such differences also can exist in natural joints and might influence the progression of arthritis. The large increase in friction during each step could be caused by the synovial fluid being squeezed out under load.
 David Whitby is chief executive of Pathmaster Marketing Ltd. in Surrey, England. You can contact him at pathmaster.marketing@yahoo.co.uk
.