Unraveling the mystery of oil analysis flagging limits
Jeanna Van Rensselar, Senior Feature Writer | TLT Feature Article January 2016
The limit-setting perspectives may be different, but the goal is the same—prolonging the life of equipment.
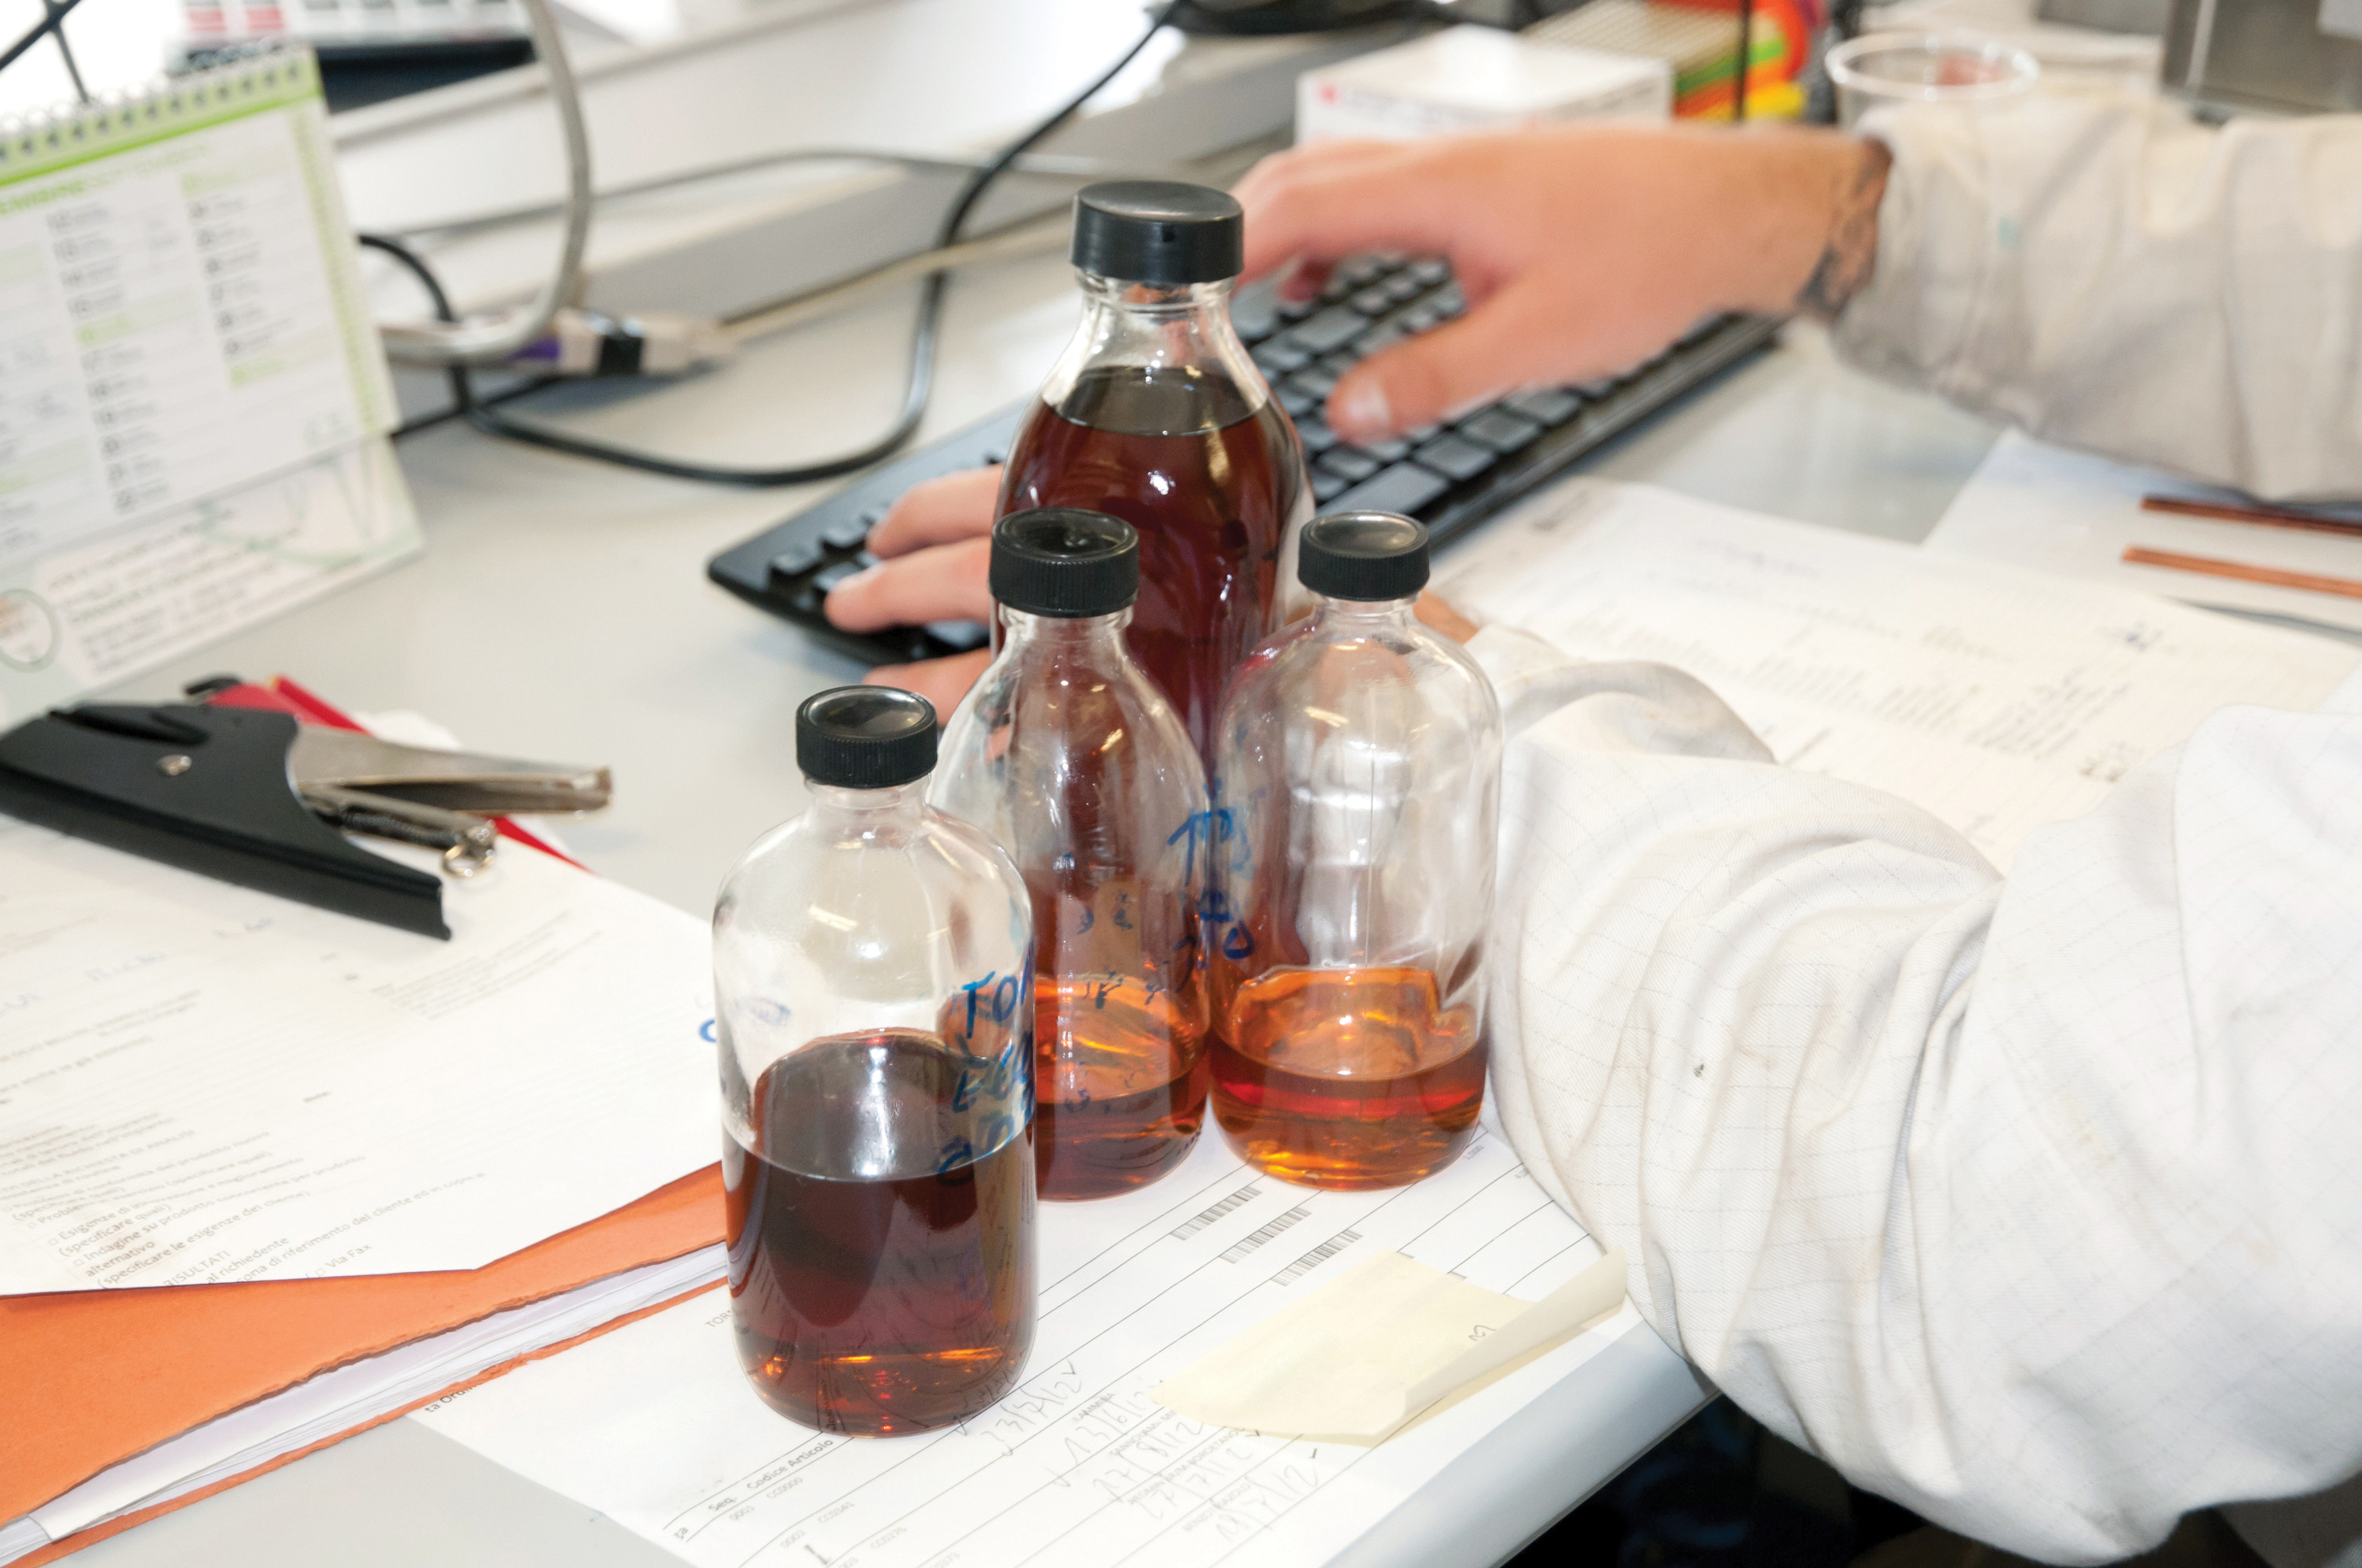
© Can Stock Photo Inc. / morenosoppelsa
KEY CONCEPTS
•
OEMs, formulators and labs don’t necessarily have different flagging limits, but they do have different perspectives.
•
Every limit-setting entity has a stake in prolonging the life of the equipment.
•
Trust between the end-user and the limit-setting organization is essential.
 AN OIL ANALYSIS REPORT CONTAINS RESULTS ON ANYWHERE FROM 20 TO 40
 parameters that each has acceptable ranges identified. The type of oil, its formulation, how it should be maintained and the operating conditions all come into play when evaluating an oil sample and setting acceptable ranges. Also paramount is the type of equipment and the operating environment.
Standard processes for the establishment of normal ranges, along with the identification and revision of limits and a reliable system for recognizing failure modes, are the basic components of an acceptable oil analysis program.
Most labs offer comments and recommendations in the form of flags that are patterned after green, yellow and red traffic lights. Yellow and red flagged parameters indicate that a threshold has been passed and further action is required on the part of the end-user; green flagged information is archived for trending.
Some parameters, such as particle counts, only have upper limits. Other parameters, such as oxidative stability, only have lower limits. Parameters such as viscosity (
see Figure 1), that measure stability, have both upper and lower limits.
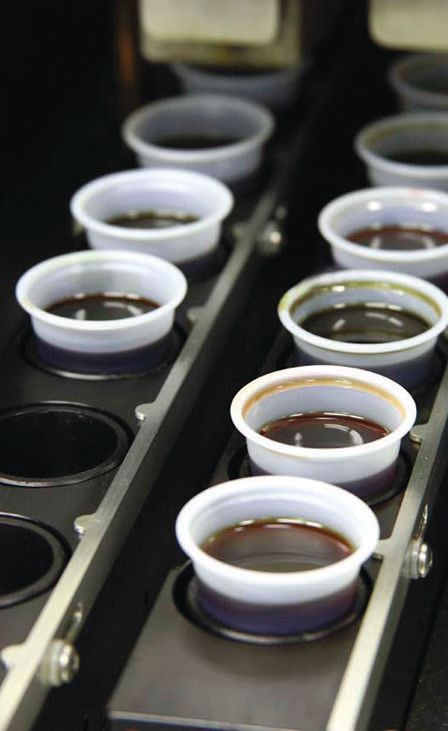 Figure 1. CAV viscosity cups. (Photo courtesy of ALS Tribology.)
There is not a universal approach for setting alarm limits. Also, some parameters and stats on the lab report are not critical to that specific piece of equipment. So not every oil analysis parameter needs an alarm limit (
see Figure 2) (
1).
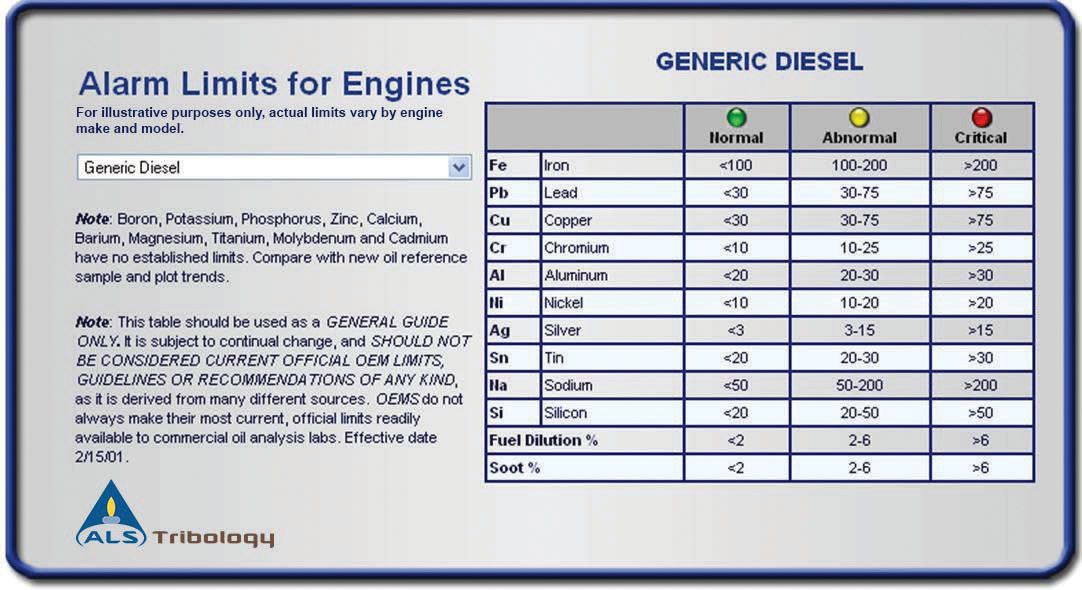 Figure 2. Generic diesel alarm limits. (Photo courtesy of ALS Tribology.)
Because oil analysis is as much expertise as formulae and there are so many considerations involved, most labs do not publish limit information. The issue for end-users is who sets the range and who to believe—formulator, OEM, lab, industry, association such as ASTM—and why (
see ASTM D7720-11).
ASTM D7720-11
Following is an oil analysis reference developed by standards-setting organizations:
•
ASTM D7720-11
Standard Guide for Statistically Evaluating Measurand Alarm Limits when Using Oil Analysis to Monitor Equipment and Oil for Fitness and Contamination: This guide teaches statistical techniques for evaluating whether alarm limits are meaningful and if they are reasonable for flagging problems requiring immediate or future action. The intention is to increase the consistency, usefulness and dependability of condition-based action recommendations by providing a meaningful and practical way to evaluate alarm limits.
•
ASTM D7720-11 provides specific requirements to statistically evaluate alarm limits. It may be applied to sample data from testing of in-service lubricating oil samples collected from machinery. The techniques covered deliver outputs that may be compared with other alarm limit selection techniques, but they do not preclude or supersede limits that have been established and validated by an OEM.
ABSOLUTE AND TREND LIMIT-SETTING METHODS
There are four traditional absolute methods for determining oil analysis ranges and flagging limits. These methods are (
2):
1. Industry standards. These are generic limits placed on machines that are grouped according to working pressure or type (e.g., gearboxes or hydraulic systems). These standards are generally considered baseline. Limits set by industries and associations often involve equipment with strict safety and reliability requirements. These limit values should be carefully considered.
2. Statistical alarms. These are based on common distribution functions that are usually built into software—either the cumulative distribution function (
3) or the Gaussian distribution (
4).
3. Trend-based or rate-of-change limits. These define an unacceptable departure from a usual level. There are three ways of developing trend or rate-of-change alarms:
a. Relative magnitudes. This identifies a significant change in magnitude.
b. Rolling average. This compares the current value to the average of several historical measurements.
c. Weighted delta settings. This uses a weighting method that requires a very large change to occur before an alarm is tripped for a small measured value. As the measured value increases, the required percentage change decreases.
4. No predefined limits. These are judgment based and rely on the availability of experienced analysts familiar with the type of machinery being monitored (
see Choosing Machinery to Monitor—The Criticality Index).
CHOOSING MACHINERY TO MONITOR—THE CRITICALITY INDEX (5)
The Criticality Index determines the logical extent of condition monitoring required for a piece of equipment. It takes into account such factors as:
•
The importance of the machine’s function
•
Whether or not there is another piece of equipment that can take over the function if that piece of machinery fails
•
The overall impact of downtime
•
The projected repair cost.
This index assigns all machines to one of the following three categories:
1. Critical machinery. These are machines that are so important that the rest of the operating environment cannot function without them (i.e., power plant turbines). Equipment in this category requires complete online and (where possible) inline condition monitoring—regardless of cost. The specifics of monitoring are often included in insurance policies and warranties. This equipment is a prime candidate for predictive maintenance.
2. Essential machinery. This equipment is key to the operating environment, but its failure does not cripple operations. Sometimes equipment that falls into this category would be considered critical if not for the fact that a backup piece of equipment is readily available. While testing is not as important as it is with critical machinery, it is recommended in order to prevent costly repairs and inconvenience.
3. General purpose machinery. The balance of operations equipment falls into this category. These machines are usually monitored informally and periodically.
Experienced analysts are enormous assets to any lab. STLE-member Bryan Debshaw, CEO of POLARIS Laboratories®, explains, “A key component of a reputable independent laboratory is the human element (the personnel reviewing and analyzing the data and then translating it to accurate and reliable actionable recommendations). Ensuring the individuals have the appropriate technical competencies to make impactful recommendations is fundamental to maximizing the value of a fluid analysis program. On a personal level, this is akin to seeking a doctor with the appropriate expertise and training when investigating a personal health concern. STLE certifications are excellent measures of technical competencies.”
He adds, “A qualified technical data analyst will have relevant industry experience and bring value to the recommendations by considering a multitude of factors rather than focusing on a single test result and evaluating it without consideration of other key data. In addition to statistical anomalies, a data analyst reviews rates of change and the amount of time on both the equipment and fluid.”
The four absolute methods described above are most effective when:
•
failure modes and root causes are known (
see Definitions of Failure) or
•
oil property requirements are closely defined and a change can be directly connected to operating conditions.
DEFINITIONS OF FAILURE
The basic definition of failure is the point at which the component, system or process no longer provides the function for which it was designed or where the degraded performance of the component is unacceptable.
Following are more exhaustive definitions your condition monitoring team might find useful:
•
Event in which any part of an equipment or machine does not perform according to its operational specifications. Failures are classified into several categories: dependent failure, non-critical failure, random failure, etc.
o
Dependent failure. Dysfunction, malfunction or breakdown of an assembly or subassembly caused by the failure of an associated sub-assembly or component.
o
Non-critical failure. Failure that degrades performance or operational capability of a system but which can be tolerated for a brief period before correction.
o
Random failure. Defect or failure whose occurrence is unpredictable in an absolute sense but is predictable in a probabilistic or statistical sense (
6).
Another definition addresses consequences and prevention. Equipment failure leads to:
•
Loss of asset availability
•
Deviation from standard procedure
•
Not meeting the quality and expected target quantity
•
Loss of time, labor and money
•
Loss of an integrated system.
Equipment failure can be prevented or reduced through proper maintenance management, inspections, timely finding of problems, rectification of problems and repair (
7).
These static absolute limits are acceptable in most circumstances. But dynamic trend limits established by OEMs that also take operating hours or distances into account are becoming increasingly important because of the trend toward longer oil drain intervals and the increasing prevalence of predictive maintenance. To arrive at the trend limit, the OEM will identify the acceptable change of a parameter over time.
The advantages of trend limits include:
•
A more detailed evaluation
•
Consideration of historical data and operating conditions
•
An early warning of pending problems.
A combination of both methods is often the best approach. “Statistical analysis is the correct tool for analyzing data and setting effective and progressive flagging limits,” Debshaw says. “In addition to statistical limits, trend analysis is another tool that should be used to set effective flagging limits. For example, an increase in iron—which likely indicates a steel component is wearing—from 15 ppm to 57 ppm is a noteworthy trend to monitor even when the statistical norm is determined to be 74 ppm.”
FROM THE OEM’S PERSPECTIVE
OEM flagging limits should be considered, especially if they relate to warranty issues and clearly spell out conditions for safe equipment operation (
8). OEMs can be a good source for initial alarm levels until a baseline can be established for that specific piece of equipment by a lab.
While some OEMs specify wear limits for their equipment, they are not effective for determining the state of a component because the level of contamination and wear debris in an oil sample depends on a set of factors too complex for an OEM to assess. These factors, many of which are outside the control of the OEM, include:
•
The type of equipment
•
The equipment’s function
•
The internal and environmental operating conditions
•
The experience and expertise of the operator
•
The rate of oil consumption
•
The length of time the oil has been in use.
Equipment component manufacturers may define limits for single parameters that have a specific impact on the component’s performance or operating life. This information is usually too limited. However, in the absence of OEM limits, component limits are a reference.
According to Renae Christianson, technical specialist-product life cycle manager at Cummins, Inc., Cummins recommends setting wear metal flag limits by statistical methods. Flag limits can be set for each engine individually or by grouping similar engines.
“After the initial oil drain interval, the accumulation rate of wear metals in an oil sample should be consistent over the duration of an oil change interval and should not change throughout the life of the engine,” Christianson says. “Any step changes in wear metal accumulations should trigger a flag.”
Like all OEMs, Cummins has a lot to consider when setting flagging limits. Among the factors that Christianson cites are:
•
Engines with large oil system capacity, use of Centinel™ oil replenishment systems (9) and use of eliminator or centrifuge filtration systems. These result in overall lower contamination levels compared to an engine that has a standard sump capacity, no replenishment system and standard oil filters.
•
The time on the oil when the sample is taken. If oil samples are not taken at consistent intervals and/or oil is not changed at consistent intervals, each sample can be plotted on a graph showing wear metal accumulation versus oil hours.
•
Combinations of factors. There are combinations of wear metals, contaminants and oil health properties that, when changing together, would trigger a flag more quickly than an increase in one alone. For example, a problem with fuel dilution should not only be reflected as an increase in the percent of fuel in the oil but also correspond to a decrease in viscosity. Similarly, bearings are typically made up of different metals which, when increasing at the same time, would result in an earlier flag than seeing an increase in one metal alone.
Christianson adds that some end-users are using OEM recommendations and oil analysis as one of the inputs to determine which engines to pull out at the end of life instead of pulling out the oldest or highest hour/mileage engines first.
FROM THE FORMULATOR’S PERSPECTIVE
Flagging limits developed by oil companies tend to be focused on the oil’s condition and when the oil’s useful life is over. Phillips 66 Lubricants’ formulation experience and familiarity with the chemicals involved help them know what flagging limits should be set for a particular lubricant family. These limits are when the physical state or protection ability of the oil is changed to the point that an oil change is imminent.
Flagging limits are always monitored and adjusted with industry upgrades. A good example is when the diesel category upgraded to API CJ-4 and mandated lower sulfated ash content. This industry change resulted in lower starting base number (BN) in the lubricant.
According to STLE-member Shawn Ewing, technical coordinator commercial lubricants for Phillips 66 Lubricants, typically flagging limits utilized by commercial oil analysis labs are appropriate for trending of wear metals and lubricant life.
“As a manufacturer of lubricants, Phillips 66 is concerned with the properties of the fluid itself,” he explains. “Viscosity, oxidation, nitration and contamination, for example, are indicators of how well the lubricant is doing in service. The limits we set depend on the lubricant family. Heavy-duty diesel engine oils have much different flagging limits than natural gas engine oils or hydraulic fluids. We also take into consideration whether the lubricant is blended for crankcase or power transmission service. Wear metals are established by the manufacturer of the equipment.”
Ewing adds that most feedback from end-users concerns why the lubricant reached limits so quickly. If that’s the case, Phillips 66 will work with the customer to troubleshoot and improve the situation. “Customers have the expectation of long service life from premium lubricants,” he says. “If the performance falls short we get involved and resolve the problem.”
THE LAB’S PERSPECTIVE
According to STLE-member David Doyle, general manager of ALS Tribology, ALS develops limits through various sources, depending on the needs of the client or program: OEMs, fluid manufacturers, internally--using statistical data, end-user specific requirements and industry-recognized standards developed from industry-related technical bodies.
“Equipment type is just a starting point,” he says, “There are various factors that go into establishing limit requirements: consultation with OEMs, fluid manufacturers and end-users, actual equipment design and metallurgy, specific makes and models, formulation of fluid in service, age of equipment, age of fluid, rate of change, wear rate per hour, work environment and maintenance or service recently performed.”
“Laboratories generate lots of data; a sophisticated process for analyzing the data is required to turn it into relevant and actionable information,” Debshaw of POLARIS Laboratories® says. “A reputable laboratory is able to separate data by equipment manufacturer and model, lubricant product and viscosity grade and the operating environment, among other factors and considerations. They are able to offer a more precise maintenance recommendation by having different sets of flagging limits based on these and other factors. Laboratories can even set progressive flagging limits with multiple tiers so operators can make their own decisions on extending fluid life or performing preventive maintenance. The end result is precise flagging limits that are translated into accurate and actionable recommendations for maintenance personnel.”
Debshaw advises that instead of focusing on the flagging limit for an individual test, the focus should be on the maintenance recommendations in the oil analysis reports (
see Figure 3). He says, “Arriving at these recommendations requires a vast database, a thorough understanding of statistical analysis and skilled data analysis to identify potential causes from the observed effect.”
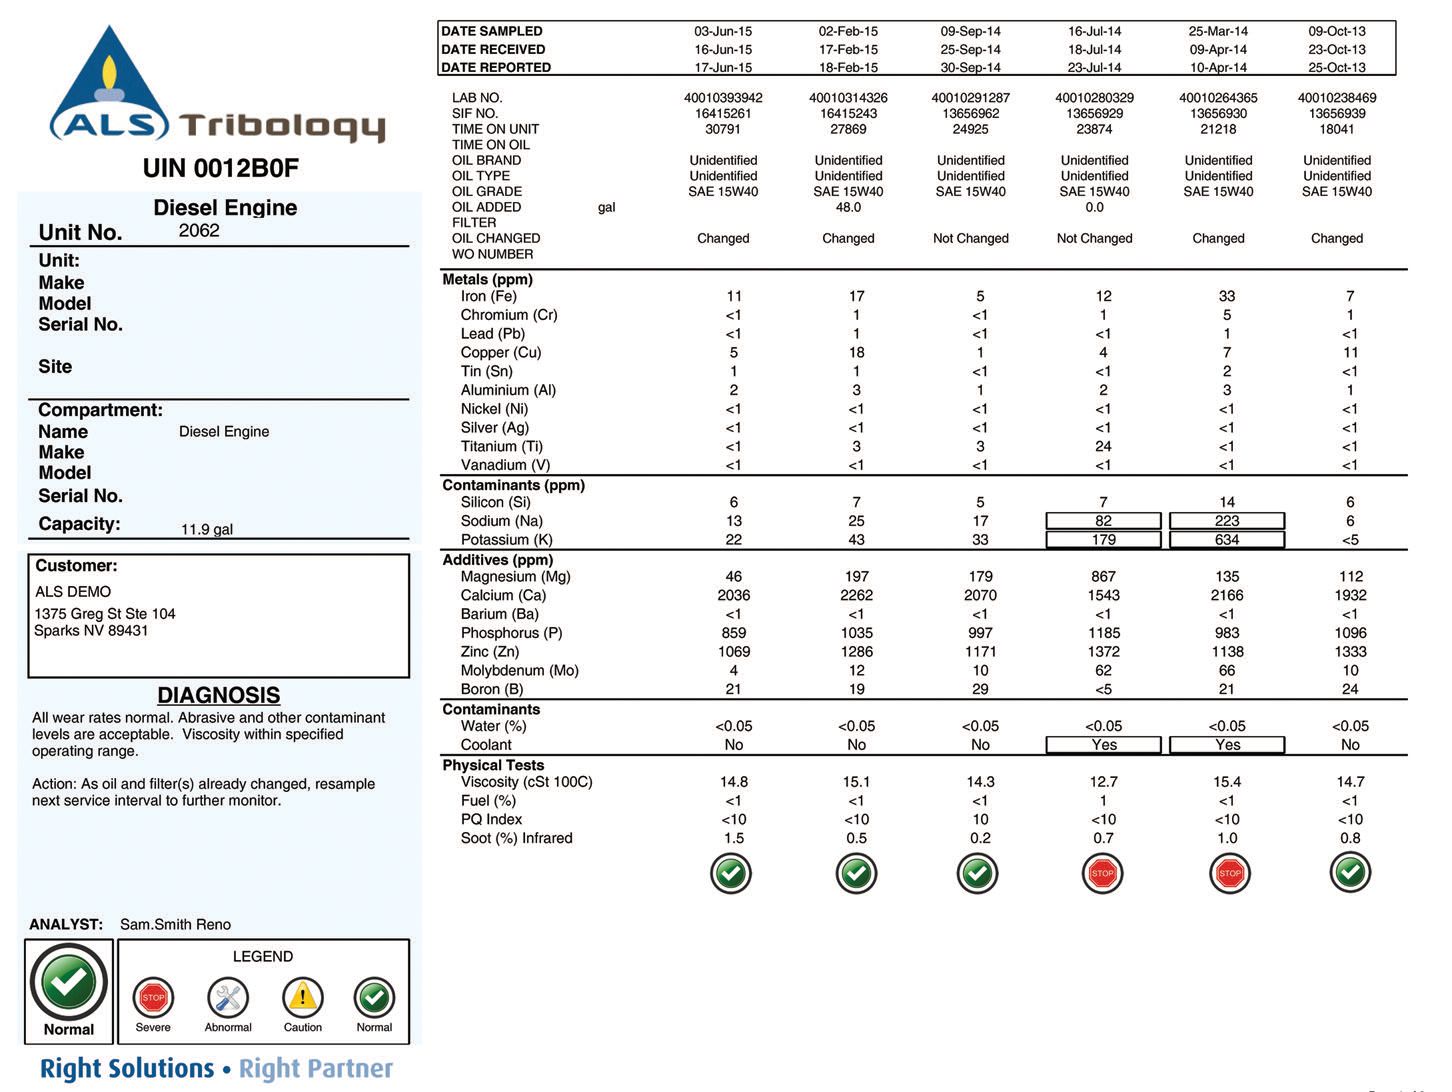 Figure 3a. Page 1 of a sample diesel oil analysis report. (Photos courtesy of ALS Tribology.)
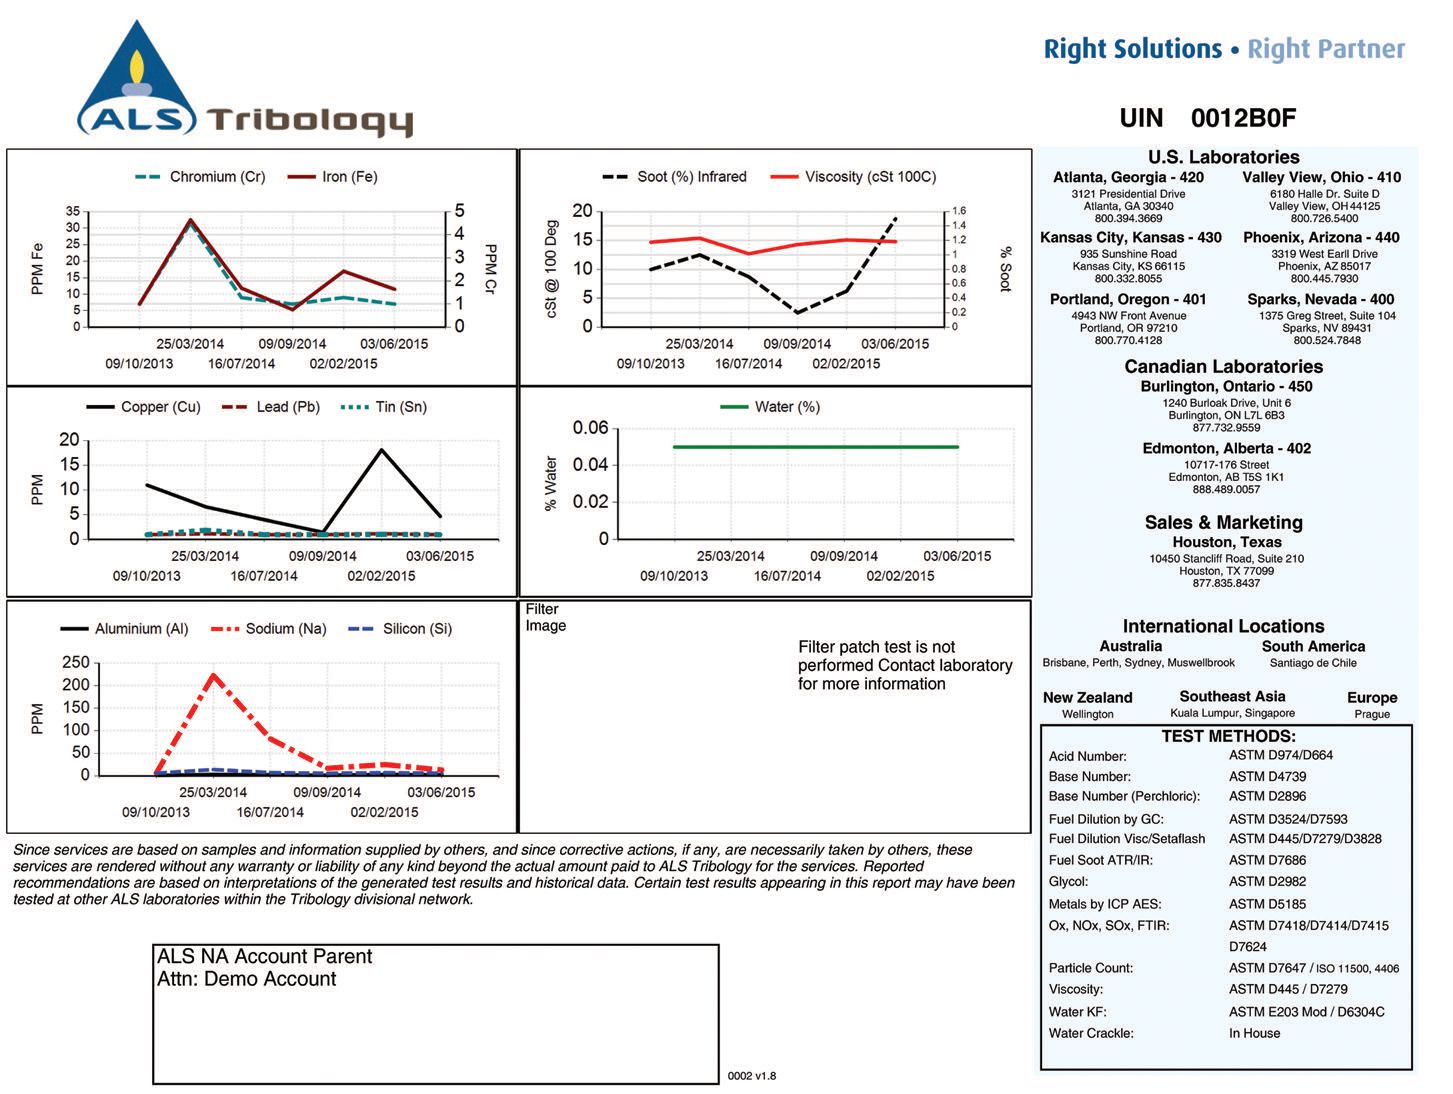 Figure 3b. Page 2 of a sample diesel oil analysis report. (Photos courtesy of ALS Tribology.)
He explains that in order to maximize the value of fluid analysis, it is essential to discern when minor corrective action can prevent major repairs. The most basic level of oil analysis catches wear before component failure, but progressive flagging limits allow maintenance to mitigate the damage caused by wear metals.
Having a multitier system identifies when data is normal, when the data trends should be monitored closely in the future, when secondary diagnostic tools and minor corrective maintenance is appropriate and when there is a severe condition and component failure is eminent.
At ALS Tribology, test reports and specific test results are segmented into four categories: normal, caution, abnormal and severe. When a condition level above normal is noted on a test report, it indicates the need for action or awareness:
•
Caution notes a situation that the client should be aware of. No action is required but the situation should be monitored (
see Figure 4).
•
Abnormal indicates a condition where a decision needs to be made by the person responsible for the equipment (whether they can live with the situation). If corrective action appears to be required, then the scope of the problem should allow maintenance or changes to occur in a timely fashion that is least disruptive to schedules and workflow.
•
Severe condition indicates that immediate corrective action is required in order to prevent further damage or impending equipment failure and work interruption.
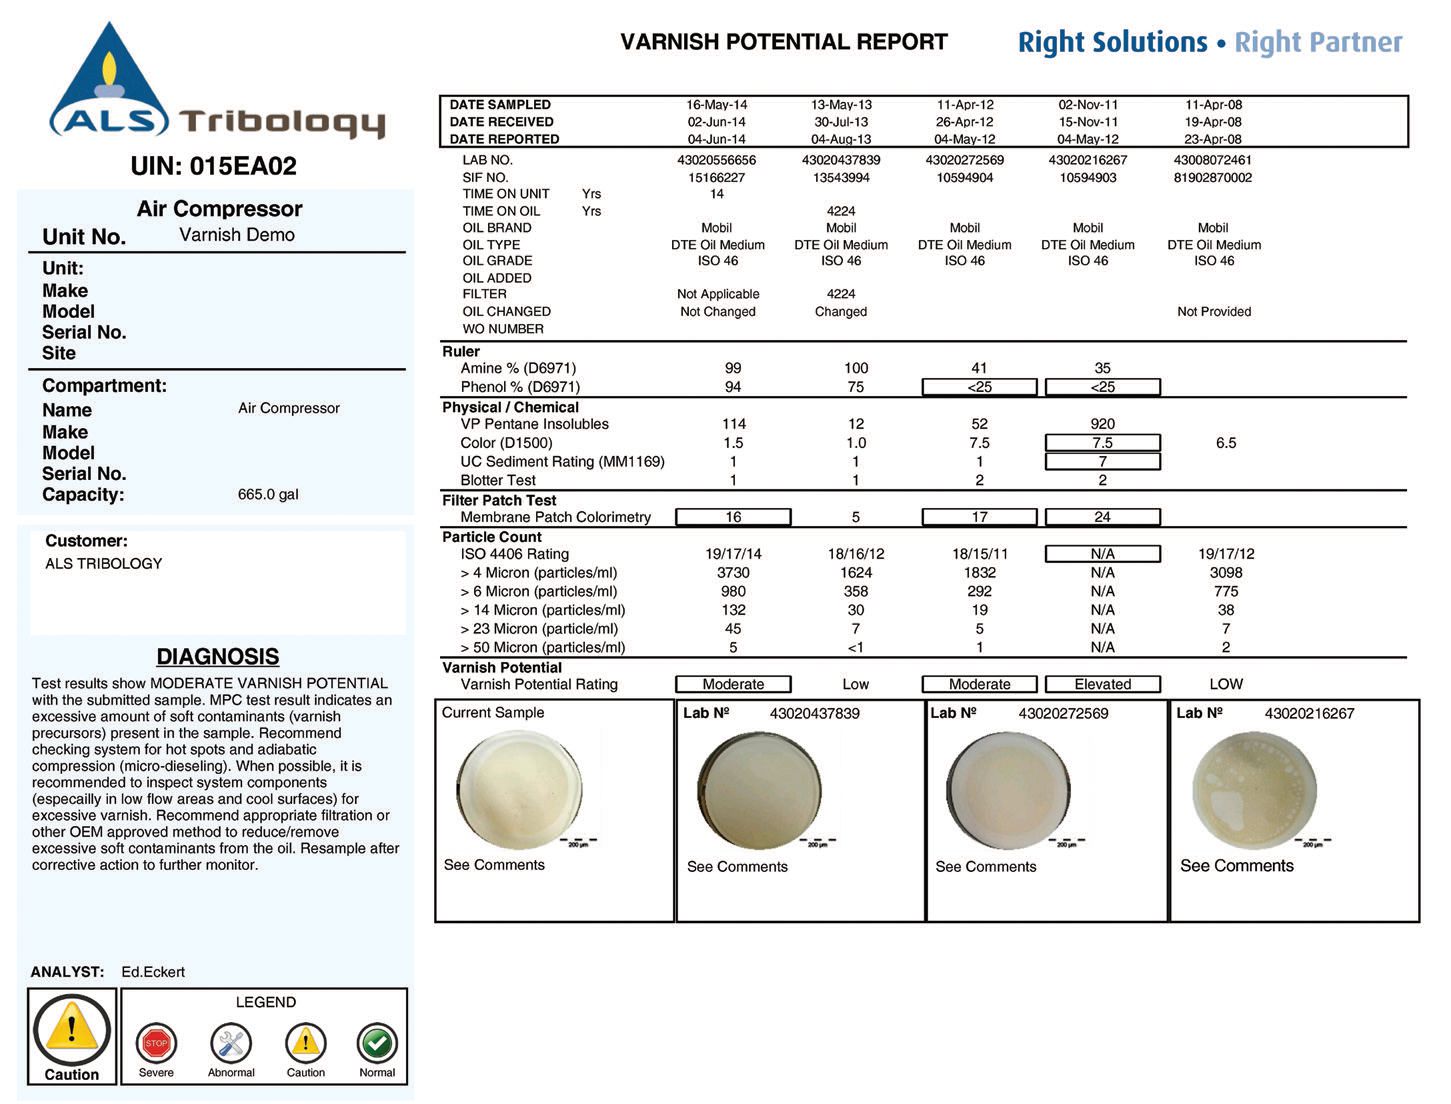 Figure 4. Sample varnish potential report. This report is in the caution category, so the situation should be monitored. (Photo courtesy of ALS Tribology.)
Quality laboratories can identify elevated wear metals and translate this to accurate and reliable recommendations regarding component wear and also identify the areas for maintenance technicians to examine the root cause of the elevated wear.
Doyle explains that ALS Tribology encourages clients to discuss the results of their test reports when they have a question. “Many times the value of the information provided on a test report can be enhanced tenfold when there is a conversation between the client and the laboratory, he says. “This benefits both parties.”
THE END-USER’S PERSPECTIVE
Oil analysis end-users have relied almost exclusively on independent oil analysis laboratories and/or oil formulators to determine when equipment is in alarm. Some organizations are setting their own limits in order to meet their own specific objectives. Others are working with OEMs, labs and limit-setting organizations to maximize the life of their equipment.
It’s a confusing situation for end-users when each limit-setting entity has a different set of acceptable ranges. The solution boils down to complying with warranty requirements and working with a reputable lab. But in the end it is the equipment owner and the maintenance team that are accountable for the health and maintenance of the machinery, and there is a lot they can do to prolong life and reduce downtime.
1. Know the equipment. Information such as equipment loading conditions and environment are important, as is familiarity with equipment maintenance manuals (
see Figure 5). All of this information should be provided to the oil analysis laboratory.
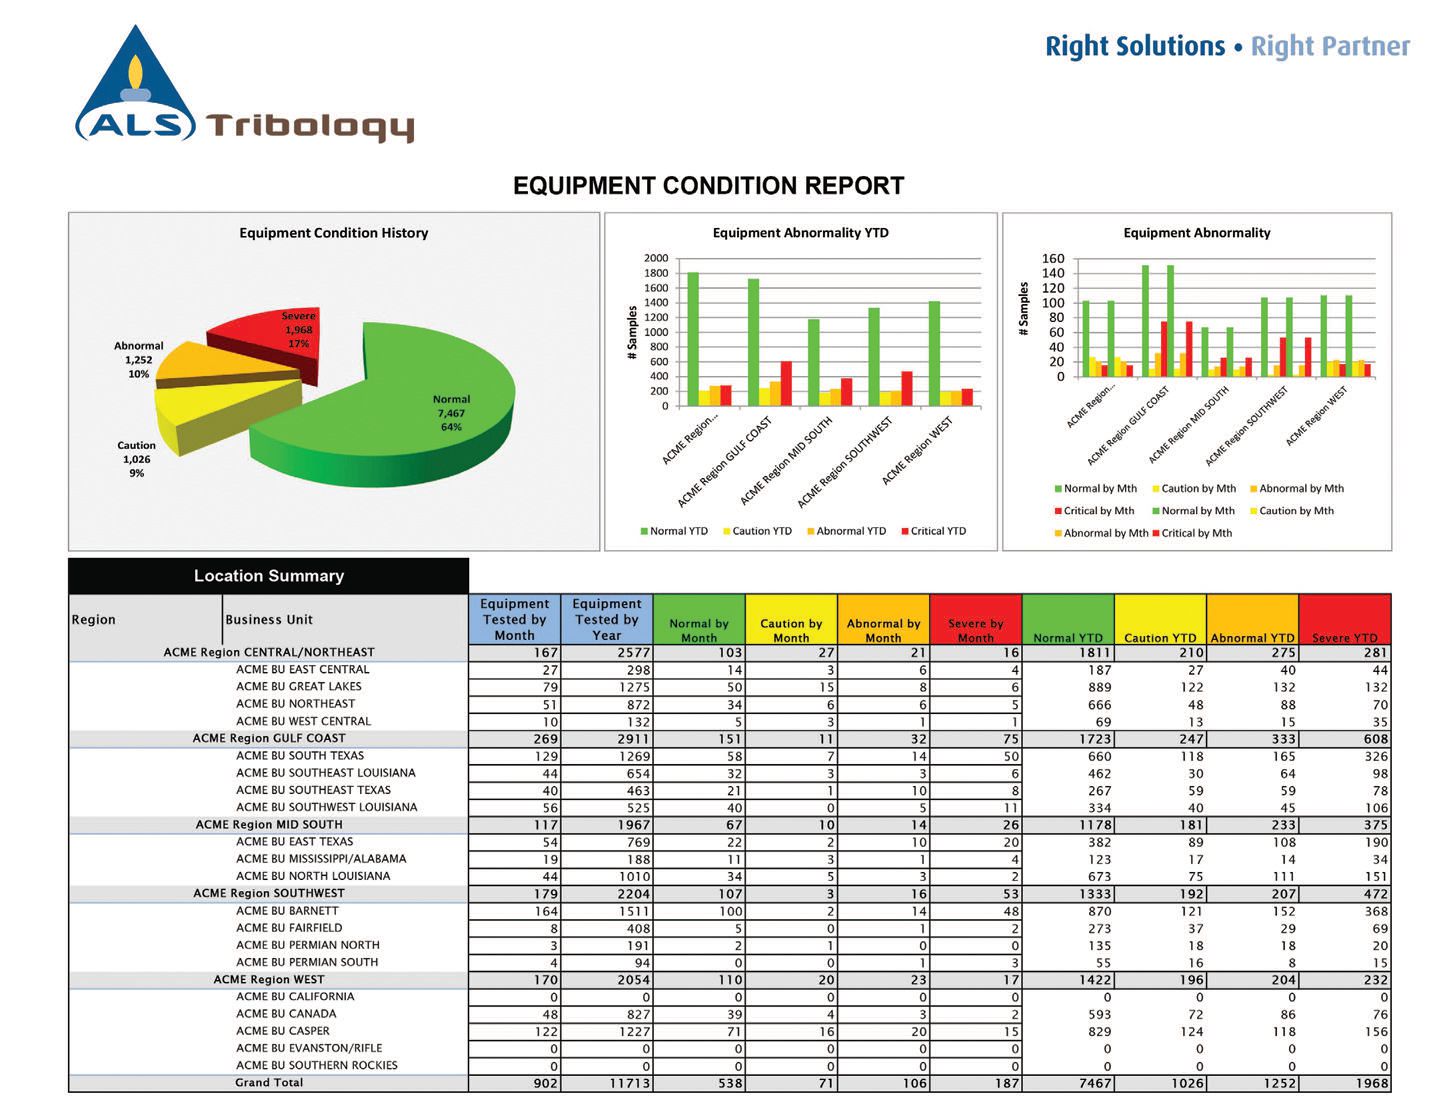 Figure 5. Sample equipment condition report. (Photo courtesy of ALS Tribology.)
2. Read equipment specifications.
Figure 5. Sample equipment condition report. (Photo courtesy of ALS Tribology.)
2. Read equipment specifications. Many OEMs publish specifications for equipment lubricants and their maintenance and guidelines for oil analysis flagging limits.
3. Assess the lubricant. Oil analysis labs frequently find incorrect lube types and/or grades in equipment. A common issue is the use of synthetic lubricants with different baseline properties than the original mineral-based oil specified in the maintenance manual. If the oil type is changed, the lab needs to have a sample of the clean oil in order to establish a baseline for future trending.
4. Understand oil analysis testing. Be familiar with the necessary tests. All test methods are subject to uncertainty—consult with the lab to discuss variation in statistical trending analysis.
5. Sample carefully. Poor sampling can cause significant distortion in the results. Follow the lab’s guidelines and sample from the same point each time. Air, oil and filter changes can result in false alarms. Also not recording and/or reporting topping off and/or draining and replenishing will artificially change wear, contamination and additive levels without any actual change in the lubricant condition.
6. Start logging operation time and fluid time. Most statistical trending software includes programs that require logging operation time in order to be valid.
7. Establish baseline trends. A monthly analysis for three consecutive months will establish a baseline trend. Beyond that, a decision may be made on the sampling frequency of that equipment with factors such as criticality included (
10).
“Flagging limits that evaluate the condition and reliability of both the equipment and fluid in service should complement other proactive maintenance practices,” Doyle says. “Limits, as well as the scope of testing, should be used to provide information that meets established goals for equipment reliability and service life, lubricant integrity, return on investment, warranty, etc.”
EVERYONE WANTS THE SAME THING
“The application of limits is not always black and white,” Doyle says. “Many times the condition of the equipment or fluid is based on a matrix of parameters heading in a detrimental direction and no one test result has actually reached a condemning limit. Limits should be practical for the client to apply. Limits should be established that indicate severity of the sample information, whether it alerts the client to a situation they should keep an eye on, if maintenance or corrective action should be performed at the earliest practical time or if corrective action should be performed immediately to prevent further problems to the equipment or business operation. Some limits also are applied to trigger additional testing, such as analytical ferrography when certain wear metals are elevated.”
While OEMs, formulators and labs don’t necessarily set different flagging limits, they do have different priorities—many of which depend on their accountability to the end-user (
see Common Flaws in Setting Limits). For example, formulators are concerned with maintaining the lubricant’s properties and OEMs are concerned with maintaining the equipment’s condition—especially during the warranty period. What they all have in common is a stake in prolonging the life of the equipment.
COMMON FLAWS IN SETTING LIMITS (11)
Common errors that can result in the misuse and misinterpretation of limits include:
1. Too many limit levels. Some condition monitoring programs include so many limit levels that recommendations at each level are blurred. Most labs use at least the following three levels:
a. Abnormal. The measured parameter exceeds the target value but is still within the in-service range.
b. Warning. The measured parameter has exceeded the desired in-service range and some maintenance action is required.
c. Critical. The machine should be shut down immediately to avoid catastrophic failure.
2. Poorly defined actions at each limit level. This is common and leads to confusion and/or ambivalence. If end-users don’t have clear actions to take when the limit is exceeded, serious conditions can be missed and the consequences of benign conditions can be exaggerated.
3. A confusing set of parameters. An overly complex list of measurements leads to a situation where users don’t have a clear understanding of what measurements mean or what parameters are required to assess their machinery. So they often do nothing.
4. Unknown limit justification. The justification for specific limits can be lost or never fully understood by end-users. Limits set at the beginning of a machine’s life can become meaningless or irrelevant due to the evolution of measurement techniques or a change in the operating environment. Even if labs don’t publish limits, they need to assure end-users that they have set limits responsibly.
Debshaw concludes, “Open, collaborative communication between end-users, equipment OEMs, lubricant formulators and independent laboratories is essential for maximizing equipment uptime and savings.”
REFERENCES
1.
POLARIS disagrees with this, commenting, “Some parameters are more important than others, and while every parameter may not be understood by the end-user, a competent lab should be able to explain and support the alarms for each parameter.”
2.
From
Questioning How Limits Are Set, by Andrew Becker, Paul Marsden, Sylvester Abanteriba and David Forrester. Available
here.
3.
The cumulative distribution function (CDF) is the probability that a real-valued random variable X with a given probability distribution will be found to have a value less than or equal to X.
4.
The binomial distribution function specifies the number of times that an event occurs in a set number of independent trials and the probability of the event occurring in a single trial. It is an exact probability distribution for any number of discrete trials. If number of independent trials is very large, it may be treated as a continuous function. This yields the Gaussian distribution.
5.
Van Rensselar, J. (2011), “Vibration analysis: The other half of the equation,” TLT,
67 (8), pp. 38-48.
6.
From BusinessDictionary.com, the definition of equipment failure. Available
here.
7.
Safeopedia: Equipment failure. Available
here.
8.
OEMs rarely specify limits for machinery operating inside industrial plants.
9.
Cummins’ advanced engine oil management system.
10.
Based on Bently Tribology Services: Setting Oil Analysis Alarms: General Considerations. Available
here.
11.
From
Questioning How Limits Are Set, by Andrew Becker, Paul Marsden, Sylvester Abanteriba and David Forrester. Available
here.
 Jeanna Van Rensselar heads her own communication/public relations firm, Smart PR Communications, in Naperville, Ill. You can reach her at jeanna@smartprcommunications.com
.