Turbine oil analysis report interpretation
Monika Malcolm, CLS | TLT Webinars June 2015
How to evaluate oil analysis data to prevent unnecessary maintenance issues.
www.canstockphoto.com
KEY CONCEPTS
•
Reliable operation of turbines saves millions of dollars of unplanned downtime.
•
Basic oil analysis tests include viscosity, elemental spectroscopy, particle count, water content and FTIR spectroscopy.
•
The ability for oil to separate from water is important in systems where significant water contamination occurs.
MEET THE PRESENTER
This article is based on a Webinar originally presented by STLE University. “Turbine Oil Analysis Report Interpretation” is available at
www.stle.org: $39 to STLE members, $59 for all others.
Matt McMahon is senior data analyst for TestOil in Strongsville, Ohio. He holds STLE’s Certified Lubrication Specialist™ certification and is an ASE Certified Master Automotive Technician. Previously, he worked in the automotive field as both a technician and instructor. In addition, Matt spent 15 years working with Insight Services and has reviewed more than 500,000 oil analysis reports. You can reach Matt at
mcmahon@testoil.com.
 Matt McMahon
IN THE POWER GENERATION INDUSTRY, reliable operation of turbines is crucial to avoiding unplanned downtime, which can cost millions of dollars. Since a substantial percentage of unplanned downtime is lubrication related, comprehensive oil-condition monitoring is warranted. Routine oil analysis for rotating equipment typically consists of a few basic tests that include viscosity, elemental spectroscopy, particle count, water content and FTIR spectroscopy.
There are a number of additional oil analysis tests available that, when added to the basic tests, can provide a more complete picture of lubricant condition. The additional information may provide early indication of the need for maintenance, which can then be scheduled for planned outages.
This article, based on an October 2014 STLE University Webinar presentation by Matt McMahon of TestOil, examines various testing methods utilized for turbine oils. Sample case studies also will be presented at the end of this article for interpreting turbine oil analysis data reports.
TESTS FOR TURBINE OIL CONDITION MONITORING
Turbine OEMs typically have recommendations regarding suggested oil analysis testing, testing intervals and acceptable ranges for test results. Often lubricant manufacturers provide similar recommendations for their products. ASTM D4378-13 Standard Practice for In-Service Monitoring of Mineral Turbine Oils for Steam, Gas and Combined Cycle Turbines is another resource for recommendations regarding selecting testing for condition monitoring of in-service turbine oil.
Some oil analysis laboratories have recognized the need for more comprehensive testing to determine lubricant condition for in-service turbine oils and offer specialized test slates and reports for in-service turbine oils. Typically this includes the laboratory’s interpretation of the test results and recommendations for maintenance actions.
In addition to viscosity, elemental spectroscopy, particle count, water content and FTIR spectroscopy, the following tests are commonly recommended for condition monitoring of in-service turbine oils:
•
Water separability (demulsibility)
•
Foaming characteristics
•
Rust prevention
•
Oxidative stability (RPVOT)
•
Linear sweep voltammetry (RULER)
•
Ultracentrifuge testing
•
Membrane patch colorimetry (MPC).
Basic testing may be conducted at monthly or quarterly intervals, while additional testing may be conducted at longer intervals, either annually or semiannually.
Water separability (ASTM D1401). For this test, 40 ml of the oil is mixed with 40 ml of water in a heated bath (
see Figure 1). After mixing, the sample is observed at five-minute intervals, and the amounts of oil, water and emulsion are recorded. The test continues until a passing result is observed. If no passing result is observed, the test is ended at 30 minutes for samples with viscosity less than 90 cSt at 40 C, or at 60 minutes for samples with viscosity greater than 90 cSt at 40 C. A passing result is defined as 3 ml or less of emulsion.
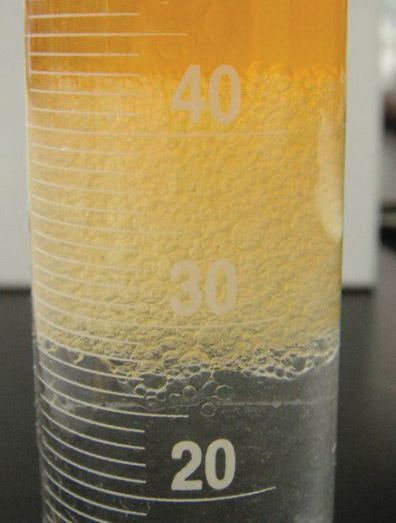 Figure 1. Water separability test where oil is mixed with water in a heated bath.
Water contamination can result in oil degradation, additive depletion, corrosion of metal system components and improper lubrication. The ability of the oil to separate from water is especially important in systems where significant water contamination is likely such as steam turbines. Factors that can affect the ability of the oil to separate from water include the age of the oil, repeated or prolonged water contamination, the presence of polar contaminants and the addition of an incompatible lubricant.
Foaming characteristics (ASTM D892 Sequence I). Air is blown through a portion of the oil at a fixed rate in a controlled temperature bath for a set time. The sample is then allowed to settle until the foam has dissipated or for a maximum time of 10 minutes (
see Figure 2). The result is reported as the amount of foam present at the cessation of blowing, known as the foaming tendency. The amount of foam present at the end of the settling time is known as the foaming stability.
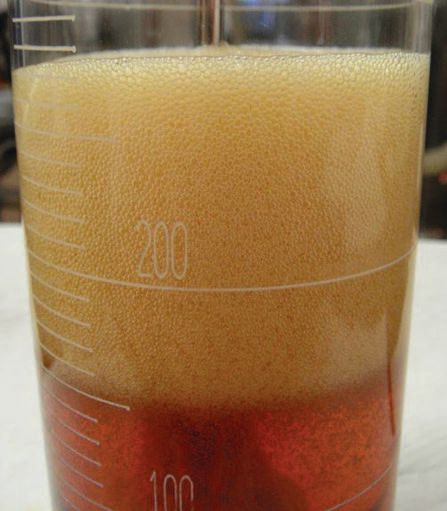 Figure 2. The foaming characteristics test. Air is blown through a portion of the oil in a controlled temperature bath for a set time.
Excessive foaming is of concern for several reasons.
Excessive foam may result in safety issues due to the foam overflowing the reservoir. Excessive foam can be detrimental to the lubricant, as the increased exposure to air can result in more rapid oxidation of the oil. Mechanical issues such as loss of lubrication and cavitation can also result from the presence of excessive foam. Foaming is most commonly caused by mechanical issues that introduce excessive amounts of air into the oil. Lubricant-related causes of foaming include particulate contamination, addition of incompatible lubricant and addition of excessive amounts of antifoam additive.
Rust prevention (ASTM D665). A portion of the oil is placed into a vessel along with a stirrer (
see Figure 3). The vessel is placed into a heated-controlled temperature bath. A steel test rod is immersed in the heated oil. The sample is then stirred in the heated bath for 30 minutes to ensure complete coating of the test rod. Then water is introduced into the vessel and the sample is stirred for an additional four hours. At the completion of the test, the test rod is observed for signs of rust.
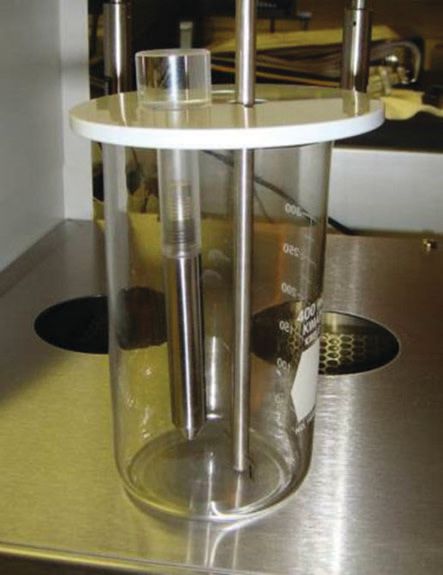 Figure 3. The rust prevention test where a portion of the oil is placed into a vessel.
Turbine oils are fortified with rust inhibitors, which protect metal surfaces by plating out onto the surfaces to form a protective layer. A failing result from ASTM D665 can be an indication that the system may be at risk for corrosion. One potential root cause for a failing rust prevention test result is additive washout due to water contamination. A second potential root cause is introduction of another product with incompatible additives.
Oxidative stability (RPVOT) (ASTM D2272). A portion of the oil is placed in a pressure vessel along with water and a copper catalyst (
see Figure 4). The vessel is then pressurized with oxygen and placed into a heated bath. The vessel is rotated, and the pressure within the vessel is monitored. As the oil reacts with the oxygen, the pressure within the vessel drops. The result is reported as the time in minutes from the beginning of the test until a drop in pressure of 175 kPa is observed.
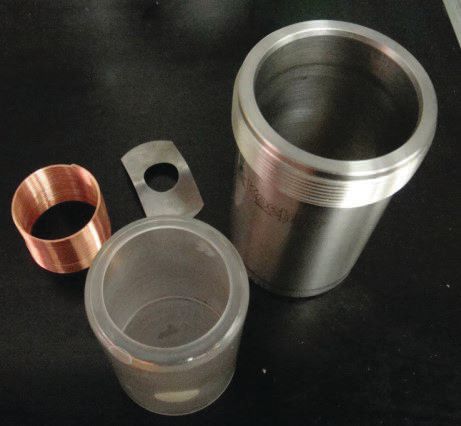 Figure 4. The oxidative stability test where a portion of the oil is placed in a pressure vessel with water and a copper catalyst.
The useful life of turbine oil is directly related to its ability to resist oxidation. As the oil becomes oxidized, acids are formed which can further degrade to form sludge and varnish. Typically, the oil’s ability to resist oxidation decreases gradually over time, as its antioxidants are consumed and the base oil gradually oxidizes. Turbine oils are expected to last from five to 20 years, depending upon the application. Trending of RPVOT results can help establish the estimated life of the fluid so that oil changes can be planned in advance (
see Figure 5).
The RPVOT result of the in-use lubricant should be compared to the new oil value for that specific product, as there is great variation in the starting RPVOT value from product to product. New turbine oil should not be selected for use solely based on the RPVOT value of the new oil. Other factors such as the ability of the lubricant to resist sludge and varnish formation also should be considered.
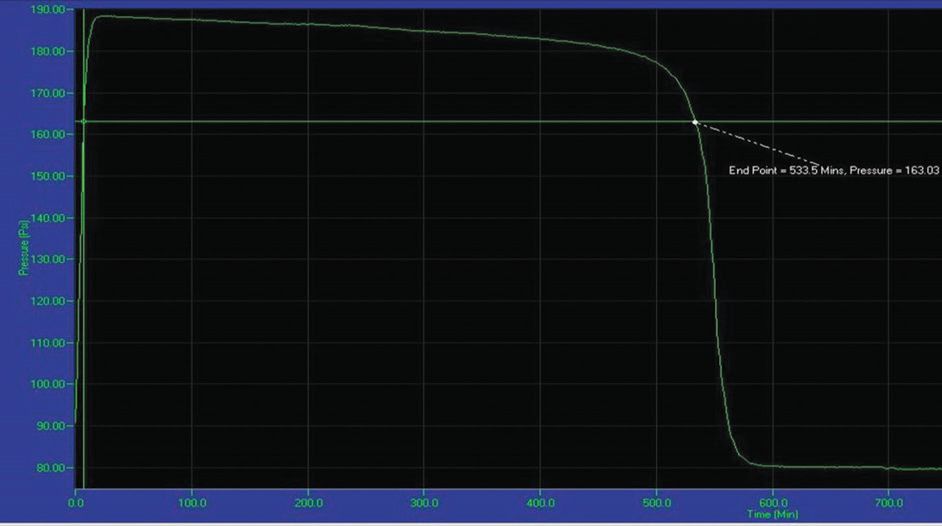 Figure 5. Trending of oxidative stability (RPVOT) results can establish the estimated life of the fluid.
Linear sweep voltammetry (RULER) (ASTM D6971 and ASTM D6810).
Figure 5. Trending of oxidative stability (RPVOT) results can establish the estimated life of the fluid.
Linear sweep voltammetry (RULER) (ASTM D6971 and ASTM D6810). A solvent is used to extract the antioxidant additives from the oil. An electrode is used to pass a voltage ramp through the solvent. The output of the test is a graph (
see Figure 6). The presence of an antioxidant is indicated by a peak on the graph. The location of the peak is related to the type of antioxidant, and the size of the peak is related to the amount of antioxidant present. By comparing the size of the peaks produced by the in-use fluid to the size of the peaks produced by new fluid, percent-remaining antioxidants can be calculated. In order to have the most accurate percent-remaining calculation, the in-use lubricant should be compared to a new oil reference that is the same formulation of the same product.
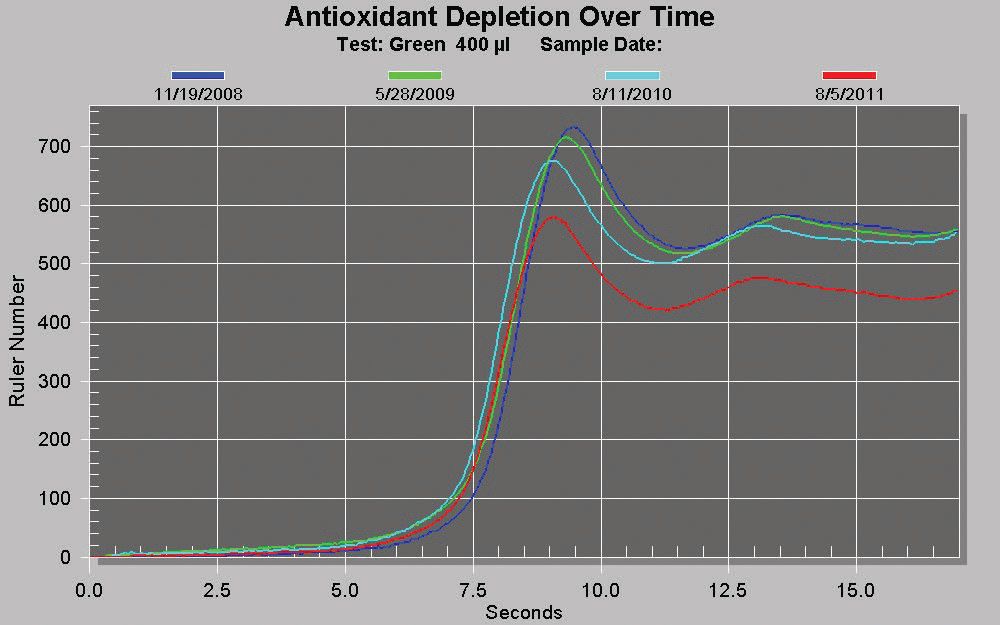 Figure 6. The linear sweep voltammetry (RULER) test where a peak on the graph shows the presence of an antioxidant.
This test is also meant to be a way to monitor the remaining useful life of the oil. While RPVOT is monitoring the combined ability of the antioxidants and the base oil to resist oxidation, RULER looks directly at the amount of remaining active antioxidants. As antioxidants become depleted, the ability of the fluid to resist oxidation decreases.
Ultracentrifuge test. A portion of the oil is spun at a high rate of speed in an ultracentrifuge. This causes higher density molecules to be forced to the bottom of the centrifuge tube, where they can form a deposit on the wall of the tube (
see Figure 7). The amount of deposit material is visually rated on a scale of 1 to 8, where 8 is the largest amount of deposited material. It is important to note that hard particles and water also will be forced to the end of the centrifuge tube and will affect the test result. Therefore, if there is a high level of particulate or water contamination, it’s best to resolve those issues before conducting this test.
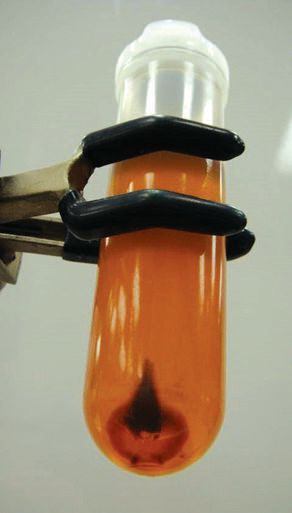 Figure 7. The ultracentrifuge test. A portion of the oil is spun at a high speed in an ultracentrifuge, which causes higher density molecules to be forced to the bottom of the tube.
As oil degrades by oxidation, the degradation products tend to be larger, heavier molecules than the original oil molecules. These degradation products also tend to have limited solubility in the oil and can plate out on metal surfaces in the system, forming sticky deposits (varnish). This can result in operational issues such as sticking valves, coated heat exchangers and reduced clearances.
Membrane patch colorimetry (ASTM D7843). A sample of the oil is held at an elevated temperature for 24 hours and then held at room temperature for an additional 72 hours. After the hold time, the oil sample is diluted with a solvent and then passed through a .45 micron membrane patch. After drying, the patch is analyzed with a colorimeter. The result is the delta E value on the CIE color scale. Varnish tends to be colored; therefore varnish precursor material captured by the membrane patch will cause the patch to appear colored (
see Figure 8). A high delta E result value indicates an intensely colored patch.
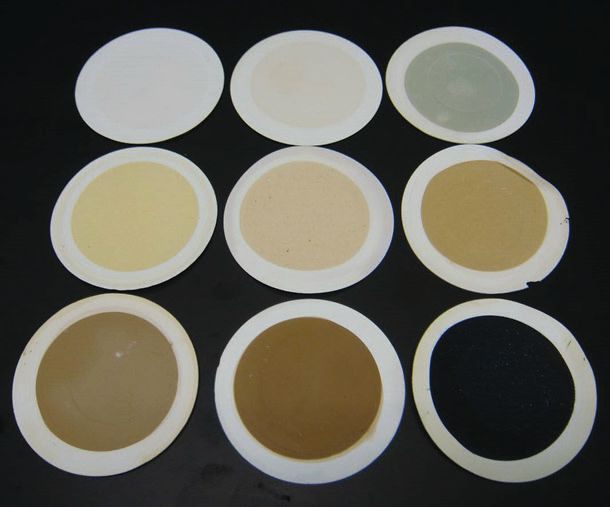 Figure 8. The membrane patch colorimetry test where varnish precursor material captured by the membrane patch will cause the patch to appear colored.
Varnishing has become a significant cause of unexpected downtime in the power generation industry. Monitoring the level of varnish precursors present in the oil with tests such as the ultracentrifuge test and membrane patch colorimetry allows the turbine operator to take action to remove varnish precursors before they plate out and cause operational issues.
 Varnishing has become a significant cause of unexpected downtime in the power generation industry.
CASE STUDY NO. 1
Varnishing has become a significant cause of unexpected downtime in the power generation industry.
CASE STUDY NO. 1
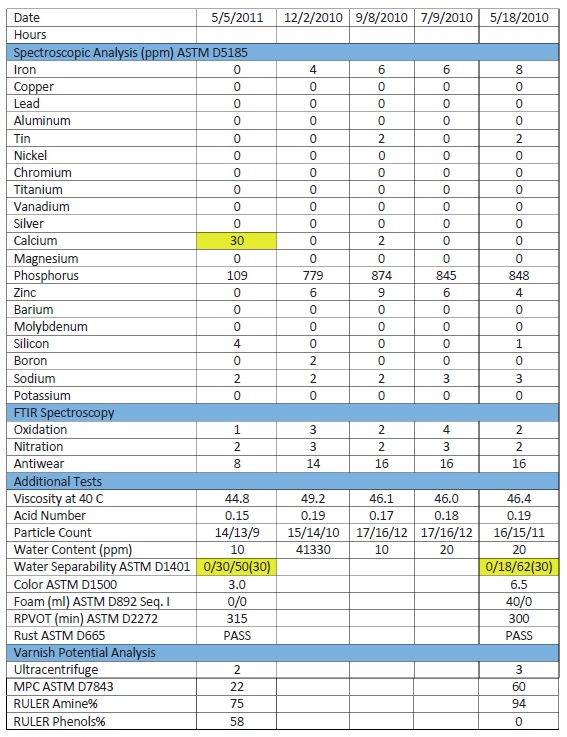
The data above was from turbine oil that was submitted for analysis to determine the overall health of the lubricant. Upon reviewing the data, it was found that the water separability (demulsibility) test results were in alarm. The oil sample failed to separate from the water in the 30-minute time period, indicating that the fluid does not readily separate from water. The previously submitted water separability test on May 18, 2010, also failed to separate from the water in the 30-minute time period.
Looking at the rest of the test data can provide more information. FTIR data shows that the oxidation has decreased between the Dec. 2, 2010, sample and current sample. The current color result has decreased from the May 18, 2010, test result, indicating the current sample is quite a bit lighter in color, and the phosphorus level of the current sample has decreased substantially from previous samples.
These results suggest that either the oil has been completely changed or a significant bleed and feed has been done since failing water separability result was observed on May 18, 2010. Also of note is the level of calcium detected in the current sample. Calcium is not typically present in turbine oil formulations and is likely a contaminant. Calcium is present in some hydraulic and engine oil formulations as a detergent-type additive. Such contamination would be expected to have a detrimental effect on water separability. Such contamination has been known to occur when new turbine oil was delivered in a tanker truck that had previously carried engine oil and the truck or hoses were not adequately flushed between deliveries. Unfortunately, the oil change or bleed and feed that was done previous to this sampling did not have the desired result of improved water separability. A complete oil change, possibly with a system flush, will be necessary due to the calcium contamination.
CASE STUDY NO. 2
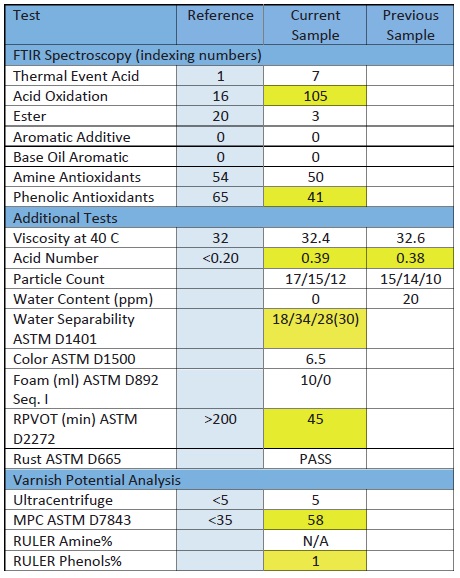
This sample had been previously observed to have an elevated acid number with routine monthly testing. This sample was submitted for a more complete test slate in order to better evaluate the condition of the oil. Additional testing for the current sample included FTIR analysis, which showed the presence of increased levels of acid oxidation products. FTIR analysis also showed a decreased level of phenolic antioxidants. The current sample was observed to exhibit poor water separability, failing to separate from water in the 30-minute time allowed.
The RPVOT result for the current sample was 45 minutes. The oil in use is expected to have an RPVOT result of about 1,700 minutes. A result of 45 is way below the recommended alarm of 25% of new oil value. The MPC result of 58 is also at a critical level, indicating a high potential for the presence of varnish in this system. RULER results also show severe antioxidant depletion. With all of these test results, an informed choice can be made for a recommended remediation for this system. It had already appeared from the elevated acid number observed in the monthly testing that this fluid was degrading.
The RULER and FTIR results in this analysis confirm that the fluid’s antioxidants are exhausted. RPVOT shows that the fluid has little remaining resistance to oxidation. The data indicates that an oil change is needed. The level of oxidation observed in the FTIR analysis and the high MPC result suggest that sludge or varnish is likely present in this sample. With this knowledge, a flush can be scheduled at an oil change to remove degradation products from the system. Without performing a flush, the new oil charge would likely have a shortened life due to being attacked by the residual degradation products from the previous charge.
CASE STUDY NO. 3
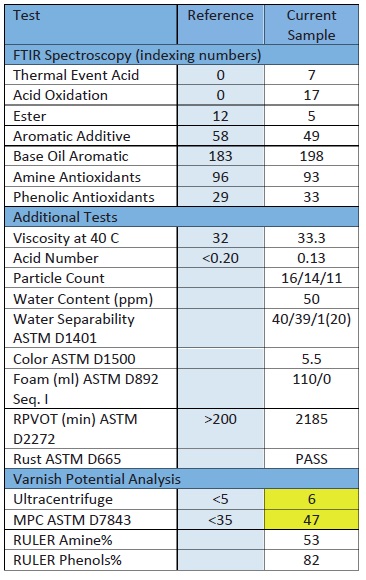
This data is from a turbine oil sample that was submitted for analysis to determine the overall health of the lubricant. Viscosity and acid number are within acceptable limits for this type of fluid. FTIR data does not show excessive degradation products, significant additive depletion or signs of contamination. RULER results also showed acceptable antioxidant levels. The particle count and water content are within acceptable limits. The sample showed acceptable water separability, an acceptable foaming tendency result, an acceptable foaming stability result and an acceptable RPVOT result. The sample also passed the rust test, indicating the oil is still providing protection from corrosion. Both the ultracentrifuge and the MPC tests are in alarm. Both of these tests are intended to detect the presence of insoluble material associated with varnishing potential.
Overall, the health of the lubricant is good, however, varnishing can be a serious issue. The recommendation for this system would be to implement varnish mitigation. If the insoluble materials can be removed from the lubricant so that varnish deposits do not occur in the system, this lubricant may provide years of continued service.
CONCLUSION
While standard oil analysis may be sufficient for monitoring the lubricant condition of rotating equipment with a relatively small sump size, additional testing is essential in establishing the complete picture of turbine lubricant health.
The cost of changing the oil in an industrial turbine is considerable, so maximizing lubricant life is desirable. This alone may be enough to offset the cost of additional testing. Though, the greatest financial gain to be made by comprehensive lubricant condition monitoring is improved reliability and less unexpected downtime.
 Monika Malcolm is a data analyst and the quality assurance manager for TestOil in Strongsville, Ohio. She holds STLE’s Certified Lubrication Specialist™ certification and has more than 10 years of experience in oil analysis. You can reach her at mmalcolm@testoil.com
.