Contamination control
Dr. Robert M. Gresham, Contributing Editor | TLT Lubrication Fundamentals April 2015
Eliminating contamination is impossible, but this three-step system will help you regulate it.

www.canstockphoto.com
KEY CONCEPTS
•
Establishing an acceptable level via the ISO code is the first step in controlling contamination.
•
The second step is performing oil sampling and analysis to determine the level of contamination.
•
Finally, select filters and filter placement to remove contaminants.
AS A CHEMIST, I ALWAYS THINK OF CONTAMINATION as arising from chemical contamination often resulting in unintended chemical reactions between materials that should be present and those that should not.
In the lubrication world, this certainly is an issue as well. Examples might be at the formulator’s shop where additives are contaminated with other chemicals that lead to an unstable formulation or some other negative outcome. And certainly in the end-user’s shop, a given lubricating oil might be contaminated with another oil of greatly different properties, leading to machine failure. I’m sure you can think of a few other examples.
But the story doesn’t end there. There are other contaminants not relying so much on their inherent reactive chemistry that can result in chaos in our machinery.
We often say that viscosity is the most important property of a lubricant, and it is. Equally important is the degree to which that lubricant is contaminated with some kind of foreign particulate material. I’m referring to those tiny, often-abrasive particles swimming around in our lubricants, blissfully grinding away at the surfaces of bearings, seals, shafts, etc. These third-body wear particles can arise from initial manufacture of the lubricant—that is, they arrive free to the customer with no extra charge from your lubricant supplier (
see Figure 1).
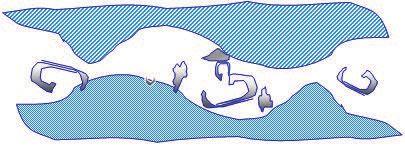 Figure 1. These third-body wear particles swim around in our lubricants and can arise from initial manufacture of the lubricant.
Additionally, these third-body wear particles can arise from improper use and maintenance of the lubricant in your shop. That is, you are allowing them entry into your equipment.
Finally, the lonely little devils create additional wear particles as a result of their wear processes on your equipment. Significantly it is the smaller particles rather than the larger ones that often cause the most damage. Let’s take a closer look.
THREE KEY FACTORS
There are three major facets to contamination control:
(1.)
Establish an acceptable level of contamination via the ISO code for each machine.
(2.)
Perform oil sampling and analysis to determine the level of contamination.
(3.)
Select filters and filter placement to remove contaminants.
For now, we’ll take a look at two of these and save filters for another article.
First, not all machines need the same level of contamination control. Thus, depending on the specific machine type (hydraulics, gears, bearings, etc., and also the specific model and manufacturer), there is a minimum allowable level of contamination. Remember, it is impossible to remove or eliminate all possible contamination. Thus, for a new program where we are going to start controlling contamination, anything that shows improvement from historic levels is good. After that, armed with trend data, we should be able to steadily improve to some optimal level after which pouring more money yields little gain—kind of like the old 90/10 rule.
To accomplish this goal of contamination control, we need to instill a culture of change in the plant. Everyone needs to be focused on eliminating entry of contaminants into the system. This starts with incoming quality assurance requirements on the lubricant, moves to technique for adding the lubricants to the machines without introducing contaminants and ends with the control and elimination of contamination as the machine operates, which usually involves maintenance of sealing systems and filtration.
The next issue is verification—how do we know if we are doing the job? This requires a proactive maintenance program for routine sampling and testing of the lubricant. This is done via particle counting techniques, and there are a wide variety of analytical machines that serve this purpose. These machines also vary widely in the range and sensitivity of their measurement.
Automatic optical particle counting is the most common method for particle counting. However, it is not effective for high viscosity and colored fluids, and emulsified water causes interference with particle readings. Techniques are now evolving to get around some of these difficulties, as well as determining hard particles from soft particles. Thus, it is important to select the right analytical instrument and techniques for your fluid/machine system.
Interestingly like most things in plants, if you just measure it the problem will magically improve—I think that goes to the culture change issue. In any event, after we measure the particle count, what do we do with the data?
The ISO 4406 Solid Contamination Code is the most widely used method for characterizing particle counts in oils. Historically, the method employs a two-number system, although the new standard uses a three-number system. Often a particle distribution will more or less follow a bell curve skewed one way or another. (However, I have also seen bilobal distributions and other anomalous distributions.)
Most people are currently using a three-number system now: R
4/R
6/R
14. The R is a so-called range number and represents range of the number of particles corresponding to a certain size. With three-range numbers, you get a snapshot of the distribution curve in three places.
By selecting the right particle sizes, you also can get a better picture of the number of particles that are the most deleterious to your particular machine. The range number is codified in Figure 2. In this case, the first R represents the number of particles greater than 4 microns; the second, the number represents greater than 6 and the third, the number represents greater than 14 microns. Therefore from the chart, if we have a target cleanliness for a given machine of 16/14/11, this would mean we would seek a distribution of 320-640 of 4 micron particles, 80-160 of 6 microns, and 10-20 of 14 microns per milliliter of sample.
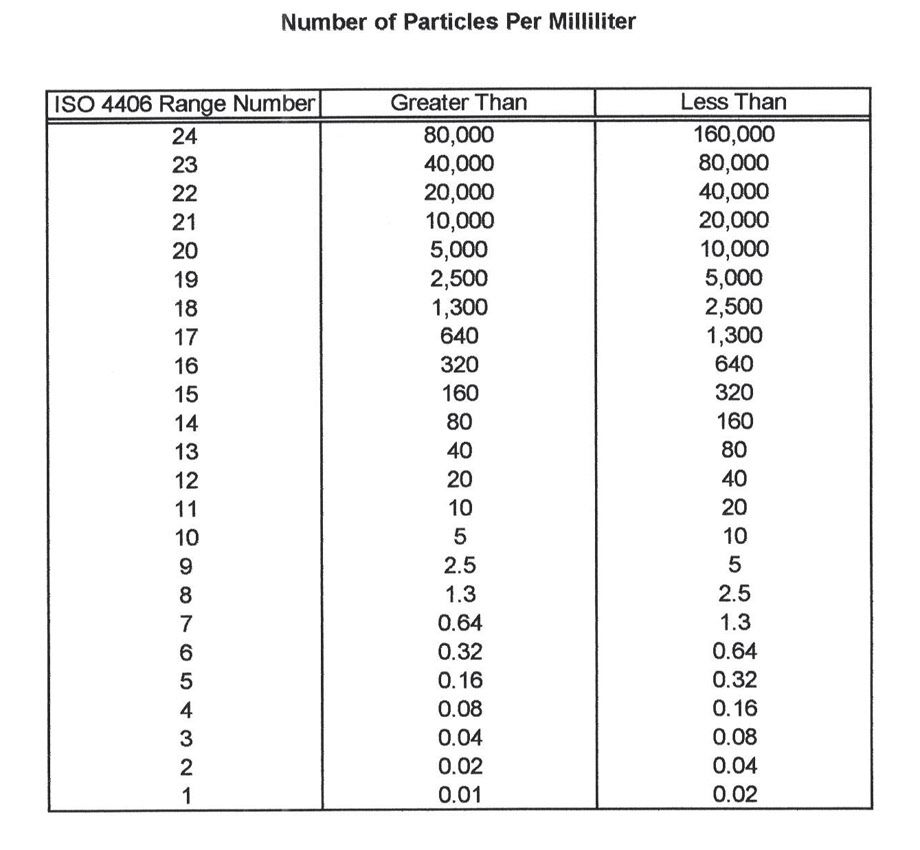 Figure 2. The ISO 4406 range numbers are codified by the number of particles.
So now we have determined the acceptable level of contamination and characterized it via the ISO code (such as the 16/14/11 example above). How do we achieve it?
After the culture change, which, believe me, will have a significant impact, we will need to install filters in our system. But alas, all filters are not the same, and they are a relatively high maintenance item as they must be monitored to be sure they are working effectively and changed when clogged or otherwise incapacitated (
see Figure 3). Additionally it is critical that they be located where they can do the most good—seems obvious, but in the real world some pretty strange installations can occur.
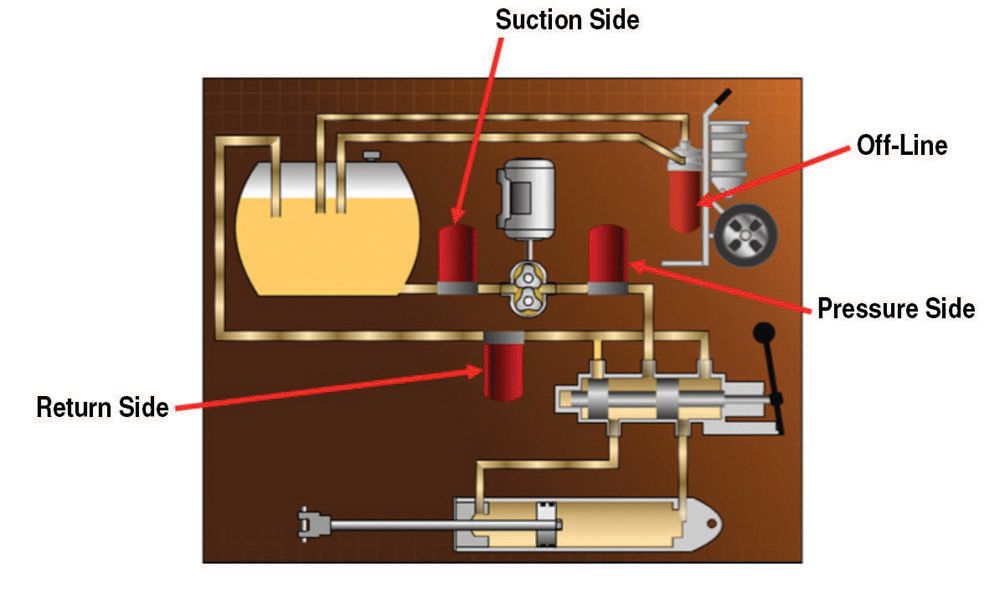 Figure 3. Filters must be monitored to be sure they are working effectively.
It is best to develop a good working relationship between your machine systems and filter suppliers to get the right filters for the job and locate them properly. Then, when it comes to operating the machine system, do what they tell you. It will pay big dividends in the long run.
 Bob Gresham is STLE’s director of professional development. You can reach him at rgresham@stle.org
.