Complexity in ISOA (a.k.a. ISFA): Part XIII
Jack Poley | TLT On Condition Monitoring November 2013
Timing is important, but size also matters.
WHAT’S ISOA? If you do a Google search, ISOA stands for its successors or assigns (legal). But that’s not what I had in mind. As we know, acronyms frequently reference more than one concept or item.
For the purpose of this article, I am taking the liberty of coining an existing acronym for in-service oil analysis. ISOA is certainly more specific and is in keeping with current terminology that technical societies such as STLE and ASTM have adopted as the official phrase for the analysis of lubricating fluids (some fluids are not oils, you know) to assess machine condition, and (yes) suitability of the fluid for continued use with safety. But isn’t the big picture about having the machine able to do its work and generate revenue?
I always found it easier to sell oil analysis by stating that the savings in lubricants from safely extended drains would pay for the program, and the machinery protection and increased uptime would be a bonus much larger than the lube extension savings. It seemed to work well at times. It also missed the point. So I’ve been part of the problem. Now I’m trying to be part of the solution. My first step is to obsolete ISOA.
ISFA
I’m gunning for two acronyms today, the first just a straw man. I remain highly dissatisfied with the term oil analysis because it is still, after six decades, viewed as an end, rather than a means, to vet lubricated machinery. Never mind that I helped the process remain misnamed. In the early days of ISFA, should we have called the process MCM: Machine Condition Monitoring (via ISFA, in-service fluid analysis)? You should see all the acronyms for ISFA, BTW.
When you go to an internist or your GP and get inspected, a blood sample is often part of the inspection. It is either analyzed in a lab in the physician’s office or, more likely, sent to a lab that specializes in blood analysis. Either way, the analogy to ISFA is clear and even appropriate these days, given the technological progress ISFA has made. The takeaway:
Test values are essential, but the data need to be assessed by an evaluator (domain expert) that can render practicable and lucid commentary to those maintaining machines.
The objective of ISFA is that the machine continues to produce revenue at maximum availability. As always, it’s about money! To be continued…
 THE MATTER OF PARTICLES
ISFA has now stretched the particle size inspection from virtual solution to 1,000 µ and larger. But there is only one instrument that can see the
entirety of these particles when properly applied: a microscope. Not just any microscope but a rather sophisticated one, maybe two in tandem, e.g., a ferroscope and an SEM (scanning electron microscope). Or a ferroscope and a micropatch. Or how about all three? If the machine’s worth a million bucks or produces half that in revenue every day, what’s the problem?
MICROSCOPIC PROCEDURES
Micropatch (poor man’s analytical ferrography?). A fairly lowpower (say 10-25-50-100x) microscope can be effectively used to inspect filter patches created by solvent extracting a specified amount of lube and passing it through a rather fine filter, often <1 µ absolute, meaning all such particles are entrapped.
Advantages include:
•
Water causes virtually no interference (exception: heavily sooted diesel engine lubes will mask most of the other benefits herein, and if water is present the problem can be exacerbated).
•
Particles of all material types are trapped without exception.
•
Non-metallic materials, e.g., filter fibers are readily identified.
•
Color and coloration in particles can be particularly revealing. Particle colors are right in front of one’s eyes. No issue espying copper, e.g., or the grey-brown translucence of abrasive Si particles.
•
Morphology (shape) is revealed simply by observing.
If lube volume is quantified, the patch can be dried and weighed, allowing trending from sample to sample for total solids contamination.
Analytical ferrography (AF) elegantly and systematically, by descending size, traps ferromagnetic particles. Nickel and cobalt are two of the other three ferromagnetic elements (gadolinium, the third, is not found in any machine I’m aware of). Ni and Co may be found in a few machine parts, where something like Stellite is involved, and Ni is also used as a barrier plate in certain bearing types, such as Cu/Pb matrix, but trust me on this, practically speaking one is basically looking at Fe-based particles, element-wise due to the overwhelming odds that only negligible traces of Ni* or Co will be included in the analysis mix. Note, too, oxides of Fe are not ferromagnetic, so barring exceptional circumstances, magnetically combed out Fe strands on a ferrogram** are almost always wear metal from a part in the machine under ISFA scrutiny.
Important disclaimer: All of us who instruct in the ISFA world badger people to ensure to extract representative samples from the component under test, lest the evaluator/expert be misled. A poorly taken sample from, say, the bottom of a sump, or just prior to the main filter, can be an evaluation disaster if a bunch of Fe “chunks” from a previous repair and marginally cleaned sump are being drawn into the sampling tube and then considered to be part of the actively circulating particles.
I’ve termed AF the “CAT scan of ISFA” (are you acronyming?) in previous articles because it truly is one of the great tests utilized in the CM world. I’ve also called it a decision-maker in the context of being a referee when an equipment teardown is being contemplated, based on test values and the expert attending to them, coupled with the ferrogram and expert No. 2 attending to that (they’re not always the same person, you know, nor do they necessarily have to be, so long as the decision expert gets the big picture). When ferrography is in play, the
final expert is often the principal caretaker of the equipment at its site. Show this person some pictures and he’ll catch on rather quickly, in fact. Nice team playing equals a teardown decision (pro or con) with high chance of being correct. Just don’t take all day to get around to all this dialogue and exchange. The reason we’re performing AF is because there are ugly data elsewhere most of the time, since most customers will not opt for the expense when it would appear to be a very useful gambit.
When I operated my labs, way back in the 20th Century, we had certain customers geared to allow us to assess the need for ferrography without asking them. I believe we honored that trust well, and I also know many of the ferrograms we generated were vital pieces of information to guide us to accurate advisories. From memory, I’d say we had as many “don’t inspect” as we did “inspection recommended” assessments, which is a bit of a hint that we were calling for ferrography at a good point in the trending and, yes, the actual verbiage was much more specific than “inspection advised” when a decision to undertake a teardown was made.
Let’s throw a stone or two at ferrography, with apology to its inventor, Vernon Wescott, and my mentor on the subject. Being fair, AF does what it purports to do, as just described. What doesn’t it do?
•
AF is Fe-based and, therefore, Fe-biased, of course, and there are times when knowledge about the other Big 4 metals: Al, Cu, Pb can be crucial to isolating the trauma area and the severity of that trauma. True, such particles do present on the ferrogram, however, there is randomness about that, first because such particles must be in the sample initially and then the aliquot the technician extracts from the sample container must contain such particles. In short, one
cannot trend non-ferrous particles with AF because the presence of such particles on a ferrogram is problematic.
•
Sometimes particles get stacked on one another, making identification difficult (the same road bump occurs with micropatch inspections). Extra dilution doesn’t usually work out, from my experience. Just deal with it. Sometimes the heat-treating options for a ferrogram will help clarify the situation.
Figure 1 is a chart I furnished in a recent TLT article, and I present it again with reduced content, wherein I’ve suggested a suite (perhaps my preferred) of methods for the particle size and composition of interest. The objective was to cover as much particle detection size range, coupled with identification, as possible with minimal instrumentation.
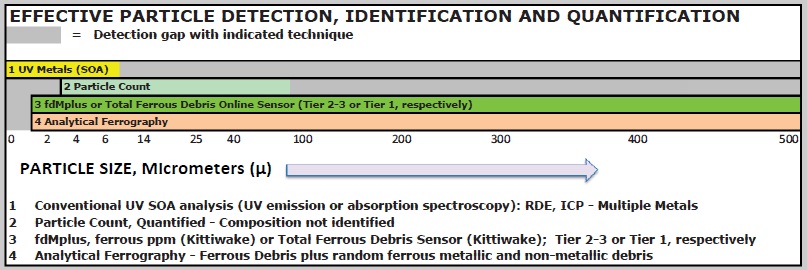 Figure 1.
With these four procedures available, we have quite full coverage, and we have a microscope within the AF inspection, our fluid CAT scan. The SEM is deliberately excluded because it is not readily available with most laboratories and it is not often utilized in the routine aspect of ISFA, whereas AF is. The lament, perhaps, is that AF isn’t applied sufficiently, owing to ill-advised frugality that many users display when the opportunity/request for AF is presented.
Next column we’ll review each procedure’s assets and limitations, yet from another perspective, application with Tier hierarchy. We’ve now set the stage for elaborating on a comment I flippantly made last article, “…don’t small particles come before large in the wear continuum?”
*Ni will usually present at <2-4 ppm in a diesel engine, and only on occasion, e.g., whereas Fe may present at >50-100 ppm routinely.
**A ferrogram is a specially manufactured slide having a center axis groove for the solvated lube sample to pass over a graduated magnetic field upon being pumped under controlled flow rates. The result is a reasonably ordered ‘combing out’ of (ferrous) particles for microscopic inspection after curing. Consistency in the lube aliquot volume and pump flow rate allow for the notion of ‘trending’ material deposition, particular of a ferrous nature.
 Jack Poley is managing partner of Condition Monitoring International (CMI), Miami, consultants in fluid analysis. You can reach him at jpoley@conditionmonitoringintl.com
.
For more information about CMI, visit www.conditionmonitoringintl.com.