Calculating lubricant viscosity versus temperature
Dr. Nancy McGuire, Contributing Editor | TLT Lubrication Fundamentals March 2021
Newer lubricant formulations are forcing manufacturers and their customers into a greater awareness of how far they can push existing standard methods.

KEY CONCEPTS
• Equations that describe viscosity changes with temperature have various strengths and limitations.
• Viscosity index is often used as an overall indicator of an oil’s quality, but this assumption is not always accurate.
• Calculation methods based on physics and chemistry could aid in the intentional design of lubricant formulations.
Though it is widely known that oil-based lubricants are less viscous at higher temperatures and more viscous at lower temperatures, calculating a precise viscosity presents a formidable challenge. Lubricant viscosity, temperature and operating conditions all interact in complex ways, some of which are poorly understood. For example, thicker lubricant films keep contacting parts well separated, but they also can increase friction and drag, which increases temperature in the contact area, which thins the lubricant film. “Most people end up having to know something about viscosity,” says lubricant formulation specialist and STLE member Jack Zakarian, principal at JAZTech Consulting. “Pretty much anybody who works in the oil industry at some point or other has probably had to do the calculations,” he adds—parts designers, OEMs, lubricant formulators and even end-users.
Despite the difficulties in untangling these interactions, trends toward faster, hotter engines and tighter tolerances require a more sophisticated understanding. Specifically, it is important to know how a specific lubricant formulation will behave over the entire range of temperatures it might encounter during operation. Testing specific oils with specific engine components would be the most direct way to find this out. However, that approach requires a significant investment of time and money. Some mechanical parts are very large or otherwise unwieldy, such that conducting standard rig tests is impractical.
Hundreds of equations
The next best solution after “test everything” is to include a viscosity versus temperature profile in an oil’s specification. This works well as long as an application falls within the parameters under which the profile was created, but it offers limited knowledge of how the oil will perform under different conditions. Thus, Zakarian says, researchers have come up with “hundreds of different equations” that allow users to measure a few data points and extrapolate an oil’s performance under a specific set of conditions.
“One reason there are so many approaches is that none of them are quite right,” says STLE member Ashlie Martini, professor of mechanical engineering at the University of California, Merced, and editor of STLE-affiliated journal “Tribology Letters.” All of them have their limitations, she says, noting that history and familiarity play a part in which calculations are used most frequently. Calculations that use only a few data points are convenient, but straying too far from these data points for either extrapolation or interpolation can give inaccurate results, she says. This is becoming more of a problem as the demand for low-viscosity lubricants, designed for high-speed engines, increases.
Viscosity index (VI) is a common method for comparing the temperature-related viscosity changes for various oils, and it requires just a few data points. However, with newer lubricant formulations and hotter-running engines (e.g., for electric vehicles), the limitations of VI calculations are beginning to become more apparent. Today’s low-viscosity oils are off the VI scale at higher temperatures, Martini says.
Other options abound. For example, the Roelands equation1 is designed so that all of the normal paraffins have a viscosity versus temperature slope of one. The Vogel equation2 is used in numerical solutions of lubricated flow, Martini says. “It’s got three parameters, so it’s a better fit, but it requires more data. It’s not widely used in industry,” she adds, noting that engineers prefer to simplify calculations wherever practical. In most cases, however, “these equations are entirely empirical, so they don’t actually correlate to chemistry at all,” she explains. “There’s really no physical meaning, and the constants that you get in these [equations] can’t be correlated back to the chemical structure.”
Walther and VI
Two well-tested methods—the Walther equation and the VI scale—are the most commonly used for practical evaluations of oil viscosity versus temperature. Because the two methods take different approaches, however, they cannot be combined.
The ASTM D341 method uses the Walther equation (see Figure 1 and equation below), which requires only two parameters and two temperature data points.
Log (log v) = A – B*log T
Where v = viscosity, cSt;
A = constant (intercept);
B = constant (slope);
T = temperature, K
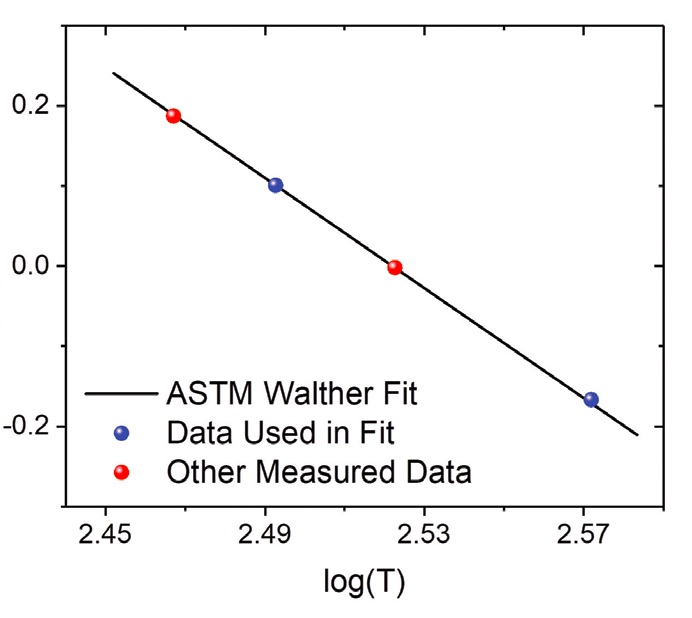
Figure 1. The Walther equation plots viscosity versus temperature using two data points. Shown here: data for 9-n-octyltetracosane. Figure courtesy of Ashlie Martini.
The results are “pretty accurate,” Zakarian says, noting that the equation is easy to use. “If you wanted to be even more accurate, you would then go to equations that might use more variables or constants,” he continues. “Obviously, the more variables you have, you get more accuracy, but then it gets a lot more difficult to do the calculation for the curve fitting. It also means you have to measure more experimental data.”
For the Walther equation, the slope of the viscosity-temperature curve changes with viscosity for oils in the same family, so it can’t be used to compare various oils in the same way that VI can. “100 VI is 100 VI, no matter what the viscosity of the oil is,” Zakarian says.
The VI method (outlined in ASTM D2270), established more than 90 years ago, indicates the degree to which an oil’s viscosity changes over a range of temperatures.3, 4 The VI scale allows users to compare their oil with two reference oils (see Figure 2 and equation below). One set of Pennsylvania crude oils exhibits little change in viscosity between 40 C and 100 C; these are designated H (high) series reference oils, with a VI of 100. In contrast, viscosities for a set of Louisiana crude oils change dramatically over this temperature range, and they are designated L (low) series reference oils, with a VI of 0.
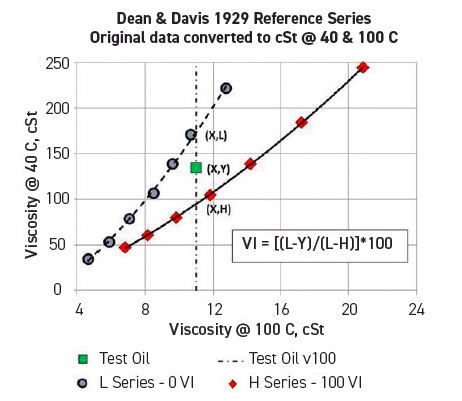
Figure 2. The viscosity index compares the way a given oil’s viscosity changes with temperature with the viscosity-temperature changes of two reference oils. Figure courtesy of Jack Zakarian.
When the viscosities of the L and H reference oils at 100 C are the same as that of the test oil,
VI = (L–Y) • 100/(L–H)
Where H, L and Y are the viscosities of the respective oils at 40 C.
The original assumption was that the VI of oils from the same source would remain constant no matter what the viscosity of the oil was at a given temperature, but this has not been borne out by observation, and attempts to “fix” the VI scale have moved away from this assumption, Zakarian says. Ideally, an oil’s viscosity would remain constant with temperature, he says, “but that’s an impossibility. So the next best thing is an oil where the change is less compared to other oils you might use.
“These days, anything [classified] as a high-quality lubricant needs a minimum VI of 95,” Zakarian says. “Most often these days, most lubricants have values of 100 or more. Synthetic oils actually have very high values—125-200 or more.” He notes that the original H series data go from kinematic viscosity values of 6.79-20.85 centistokes at 100 C, but modern oil lubricants can lie well outside the upper and lower limits of this range. VI numbers have become ingrained in people’s thinking, he says, noting that VI is used not only in a measure of viscosity versus temperature change but also as a measure of oil quality. Thus, he says, VI is always included in oil specifications because customers rely on this.
Zakarian explains that, like the Walther method, VI tells you the slope of the viscosity curve between two reference temperatures (40 C and 100 C). The original VI calculations (ASTM D567) used a quadratic curve to fit the reference oil data. However, viscosity has a double exponential (log-log) relation with temperature, and, thus, the slope changes at every point on the curve. The result is that very different oils can have the same VI. In 1964 (the most recent major revision, resulting in ASTM D2270), new logarithmic equations were introduced to handle oils with a VI of greater than 100. This is just one of several updates made to improve VI calculations, some of which have produced other side effects as oil formulations continue to change.4
VI values apply between 40 C and 100 C. At the time the scale was set up, 100 C would have been a very high operating temperature, and many oils would not flow below 40 C. “The dewaxing technology was pretty poor back then,” Zakarian says. Today, he adds, “All oils should be able to flow at 20 degrees because that’s basically room temperature.” However, changing the reference temperatures would require an oil manufacturer to change their product specifications, which has repercussions all the way down the supply chain.
Why we need better calculations
Viscosity can be measured extremely accurately, Zakarian says, using several types of apparatus to measure viscosity under various conditions, using industry standard methods. “So now we ask, can we predict it?”
“The only times you get into difficulty [using ASTM D341] might be at lower temperatures,” Zakarian continues. “As the temperature gets lower, oils will tend to gel, and eventually they crystallize and turn solid. If you have any kind of residual wax left in your oil, it can start gelling.” While the oil is gelling, it continues to flow, he says, and it is still possible to measure viscosities. “But what you’re measuring now is an oil in a different condition. And, in general, the viscosity is so much higher than you’d predict.” Thus, it’s not really possible to accurately estimate very low-temperature viscosity, he says, adding that this is still an area in the industry where it’s “basically guesswork.” However, he says, “we do pretty well at estimating viscosity up to very high temperatures,” except under certain unusual conditions. For example, the correlation could fail to hold up if the volatile components of the oil start to vaporize.
If the current standard methods are good enough under most conditions, what’s the problem? For one thing, the API oil group definitions are based in part on VI, Zakarian says. “These days, the most popular groups, especially for motor oils, would be Groups II, III and IV.” By definition, the synthetic PAOs (Group IV) and heavily processed hydrocarbon oils in Group III have a VI above 120. Group II oils have a VI between 80 and 120. However, the lower the oil’s viscosity, the more the VI scale underestimates the true VI. In actuality, the viscosity-temperature behavior of some of the low-viscosity oils is better than their high-viscosity counterparts, but the way the VI calculation is performed, it ranks them lower.
OEMs are using more low-viscosity oils now to improve fuel economy, and they can select from Group III base oils with a range of kinematic viscosities. “If all of those oils are made from the same process, by the fundamental definition of VI, they are supposed to have the same viscosity-temperature characteristics,” Zakarian says. However, VI values listed on most sales data sheets for PAO or Group III oils are consistently higher for heavier oils. “Even for Group IV PAO oils, if you’re in the low-viscosity range, your VI is low. And for the Group III oils, it actually drops below 120.” This prevents these oils from being classified as Group III, even though they were made using a Group III process. “The economic consequences are huge,” he says. “In the old days, nobody thought about it because people really didn’t use low-viscosity oils. Now it’s become glaring, and people are just living with it.”
In some cases, having a highly refined low-viscosity oil classified as Group II can be an advantage, Zakarian says. In those cases, “being called Group II actually is better for you for engine oil testing—you get more interchange possibilities.” He explains that because Group III oils do not have interchange rules (recommendations for substituting one oil for another), low-viscosity oils made using Group III processes can be classified as Group II and used instead of higher-viscosity Group II oils. “You’re applying different sets of rules to essentially the same manufacturing process,” he says. This lets customers get a Group III oil with good viscosity-temperature performance for a Group II price, but, conversely, it limits the price that a supplier can set for their highly refined low-viscosity oils. Zakarian explains that refiners can increase the VI of an oil by over-processing it, but this reduces the yield. He adds that even if a lower VI oil performed the same or better over a temperature range, customers might not accept it because they are accustomed to their usual set of specifications.
More fundamental solutions
A lot of work has been done on the theory of liquids, Zakarian explains, along with thermodynamics and chemical equilibrium, to develop better equations for viscosity versus temperature. However, he says, none of these have achieved widespread acceptance as the definitive equation in the same way that the ASTM equations have.
“In this field, there’s still a lot that is not known,” Zakarian says, but except for some limiting cases, the two-point estimates are generally very good for predicting viscosity versus temperature. “The real issue for me now is VI, where you’re trying to tell somebody in a very simple, easy to understand way with one number: How does this oil behave with temperature? The current system is really inadequate,” he says. “Most people don’t realize it, and it’s been used for so long.
Pressure and shear rate effects
Temperature isn’t the only thing that can change an oil’s viscosity—pressure and shear rates also come into play. What really counts is the oil’s viscosity in the contact zone, which determines the oil’s ability to provide a lubricating film. In an engine, the pressure can be tens of thousands of atmospheres (between about 1 and 2 GPa, or 150,000-300,000 psi). Add that to a crankshaft spinning at 3,000 RPM, and that can shift an oil’s viscosity away from what would be predicted using temperature alone.
“We have very good equations for predicting viscosity versus pressure, and we have pretty good methods for determining viscosity versus shear rate,” Zakarian says. Coefficients that account for viscosity versus pressure are good predictors of actual performance, he says. Like temperature, the pressure relationship is exponential, with viscosity expressed as e to the product of the coefficient and the pressure.
“All of these parameters—pressure, temperature and shear rate—are interrelated in their effects on viscosity,” Martini says. For instance, lubricants containing polymer VI improvers can experience shear thinning.A The main purpose of VI improver additives, she says, is to thicken oils at higher temperatures. However, the properties of these long-chain polymer additives can affect shear thinning—the shear rate at which thinning begins is inversely proportional to molecule size, with longer polymer molecules starting to shear thin earlier.
Shear rates are only significant for oils that contain polymers because shear stretches the polymer chains, Zakarian says (see Figure 3). However, essentially all engine oils have polymer VI improver additives. If the shear rate becomes high enough to break these polymer molecules, that permanently lowers the oil’s viscosity. Temporary shear loss occurs when the engine is running, and the polymer molecules orient and stretch out along the direction of the flow field. In this case, the oil’s viscosity goes back up when the engine stops.
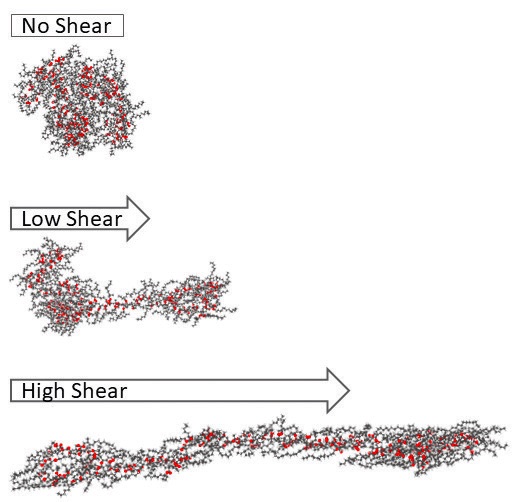
Figure 3. Polymethyl methacrylate, a viscosity index improver additive, shear thins as the polymer molecules stretch in the direction of the shear force. Figure courtesy of Pawan Panwar and Ashlie Martini.
REFERENCE
A. Martini, A., Ramasamy, U.S. and Len, M. (2018), “Review of viscosity modifier lubricant additives,” Tribology Letters, 66, 58. Available at https://doi.org/10.1007/s11249-018-1007-0.
Most people are happy with it and don’t want to change it.” He predicts that the improvements are going to come by trying to get a better way to characterize the viscosity-temperature slope with one number, when actually the slope is changing continuously on that curve. “It’s a difficult problem.”
Martini’s research group has been developing model molecules, using numerical simulations to find physical connections between molecular structures and viscosity-temperature behavior (see Pressure and Shear Rate Effects). For the near term, these studies are intended more for basic research purposes than for use as engineering tools, she says. However, in the longer term, these detailed studies might form the basis of new methods for intentionally formulating oil lubricants with specific viscosity properties, based on chemical and physical principles. In order to make this practical, she says, the complex molecular interactions need to be reduced to an “index” or similar number that is easy to calculate, based on data points that are easy to obtain, an approach that is much more efficient than running multiple measurements on a large number of candidate fluids.
For the time being, practical applications rely most heavily on the Walther and VI equations, but users must be aware of each equation’s limitations. Other calculation methods offer specific strengths, but their adoption is limited by the amount of data or computing power required, as well as the difficulty of introducing a new specification into well-established supply chains.
REFERENCES
1. Roelands, C.J.A., Blok, H. and Vlugter, J.C., “A new viscosity-temperature criterion for lubricating oils,” paper presented at ASME-ASLE International Lubrication Conference, Washington, D.C., Oct. 13-16, 1964. ASME Paper No. 64-LUB-3.
2. Vogel, H. (1921), “Das temperaturabhängigkeitsgesetz der viskosität von flüssigkeiten,” Physikalische Zeitschrift, 22, pp. 645-646. Available here.
3. Zakarian, J. (2012), “The limitations of the viscosity index and proposals for other methods to rate viscosity-temperature behavior of lubricating oils,” SAE Int. J. Fuels Lubr., 5 (3), DOI: 10.4271/2012-01-1671.
4. Zakarian, J. (October 2013), “V.I. Too Resistant to Change?” Lubes’n’Greases, pp. 54-62
Nancy McGuire is a freelance writer based in Silver Spring, Md. You can contact her at nmcguire@wordchemist.com.