Oil Analysis: What is ‘normal,’ anyway?
Jane Marie Andrew, Contributing Editor | TLT Lubrication Fundamentals September 2019
The answer depends on understanding the oil, equipment and operating conditions.

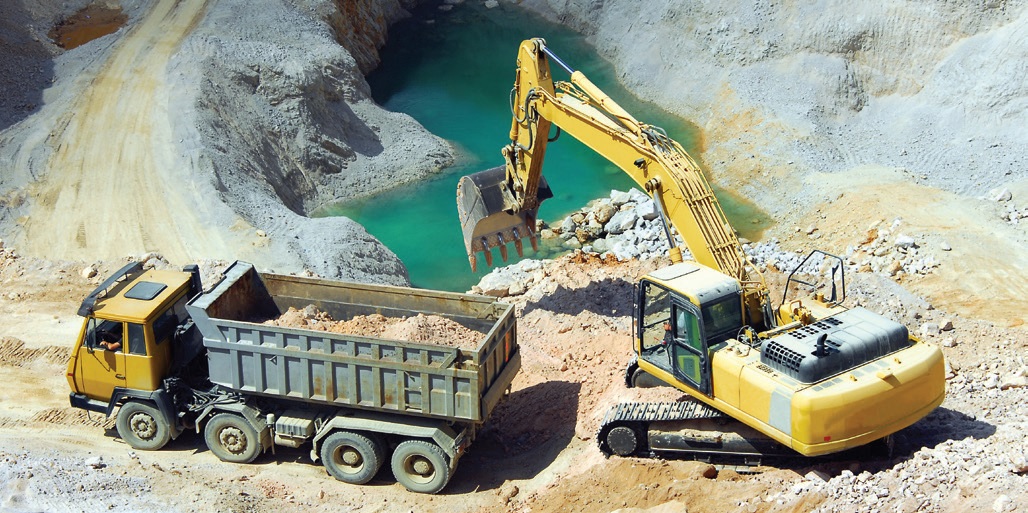
© Can Stock Photo / photography33
“I often say that oil analysis is a blood test for machinery,” says Emlyn Eager of BC Transit in Victoria, British Columbia. Most blood test reports include a normal range, but a doctor must exercise judgment before using an "abnormal" result to determine treatment. Could it be a fluke? Is it always that low? When did it change? What else is going on for this patient?
Likewise, oil analysis is used to make judgments about treating ailing fluids and components. Good maintenance judgment requires operators to take many factors into consideration, just as a doctor does.
A good oil analysis program depends on two things: spotting changes early and knowing which changes are important. Both require the oil analyst to know what’s considered normal.
It’s about understanding what can reasonably be expected for a particular situation. In a drivetrain, for example, differentials and final drives have many gears that mesh. Thus, it is normal to find wear metal in the oil from these components.
Every component has a characteristic fluid analysis profile. For example, the profile of a Tier 1 diesel engine is different from that of a Tier 4 diesel engine. The difference arises because a Tier 4 engine runs at higher combustion and oil temperatures, which cause the oil to oxidize sooner. But this is normal in a Tier 4 engine and not a concern.
Results apparently outside the normal range may be an early indicator of failure (see Red Flags). Or they could be normal for this component. Misinterpretation of normal carries risk. “On one hand, if operations are shut down to investigate a potential failure, the component may turn out to be fine, and time and money have been wasted. On the other hand, if a failing component is left in service, unexpected failure could cause catastrophic downtime,” says Naimesh Vadhwana of Kruger Products L.P. in New Westminster, British Columbia.
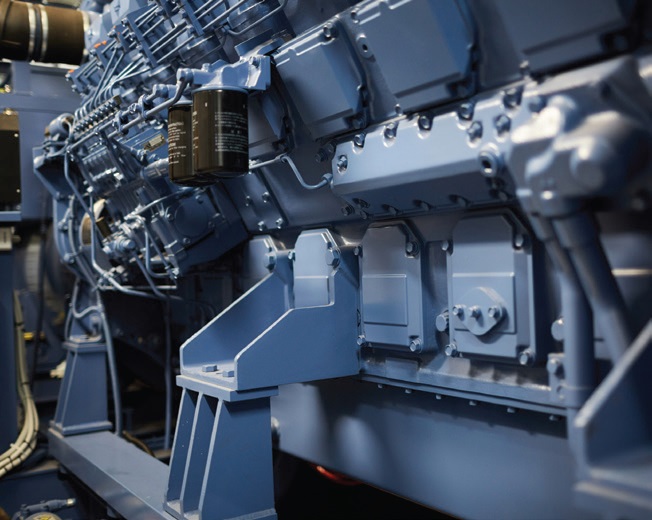
© Can Stock Photo / asel
Red flags
• Ratios of silicon and aluminum can flag dirt entry (roughly from 3:1 to 5:1 silicon:aluminum).
• Potassium in an engine sample can flag coolant contamination.
• Any drastic change between intervals—e.g., in wear rates, contamination or degradation—usually signals off-normal performance.
The skill of oil analysis is knowing how to use characteristic oil profiles and trends to convert analysis results into effective operational decisions.
Know your oil
There are two keys to knowing your oil. The first is having the exact reference sample, down to the last additive. The second is getting a good baseline: that is, knowing what characteristics a sample should have at a regular maintenance interval with a normal or acceptable amount of wear.
Eager says, “Without understanding what a good sample looks like, it’s challenging to make decisions about whether an operational sample contains acceptable amounts of wear material, contamination or degradation (see Field Report: Is It the Oil?).”
© Can Stock Photo / SeventyFour
Field Report: Is it the oil?
“This was one of the more interesting situations I’ve run into. We saw increased sodium in a particular sample. Normally in a component that is cooled, sodium would mean coolant ingress. But sodium can sometimes also be an oil additive. That’s what it turned out to be; a different oil had been used. It’s important to pay attention to exactly what oil is being used and to know when there’s been a change in oil type or if it has been topped up with a different oil.” —Emlyn Eager
Know your equipment
“A critical factor for me is that you really have to know your equipment before you start analyzing (see Getting Started),” Eager says. “That’s going to drive any further actions based on what you’re reading. If you don’t know that a particular component is externally cooled, you might misinterpret results showing coolant or water ingression. If you don’t know what materials make up a gearbox, you may miss trends that indicate excess wear.”

© Can Stock Photo / photography33
Getting started
Training for new oil analysts is usually a matter of trial by fire. A lucky beginner will have experienced workers around to teach the nuances of the equipment and operating conditions.
The solo beginner can research the history of the equipment, review prior samples and look for trends related to oil hours or unit life in that component. This review should include results from other units of the same model, if available.
In addition to learning on the job, newcomers should seek out formal oil analysis training, as well as formal training that is specific to their industry and equipment. This training can provide broader insights and key criteria to monitor.
Likewise, consider how equipment changes such as emissions adjustments, new operating parameters or new features might change the oil content (see Figure 1). For example, a new cooler might change the copper levels, or, as mentioned earlier, Tier 4 diesel engines have very different normal contaminant profiles (see Field Report: Is It the Equipment?).
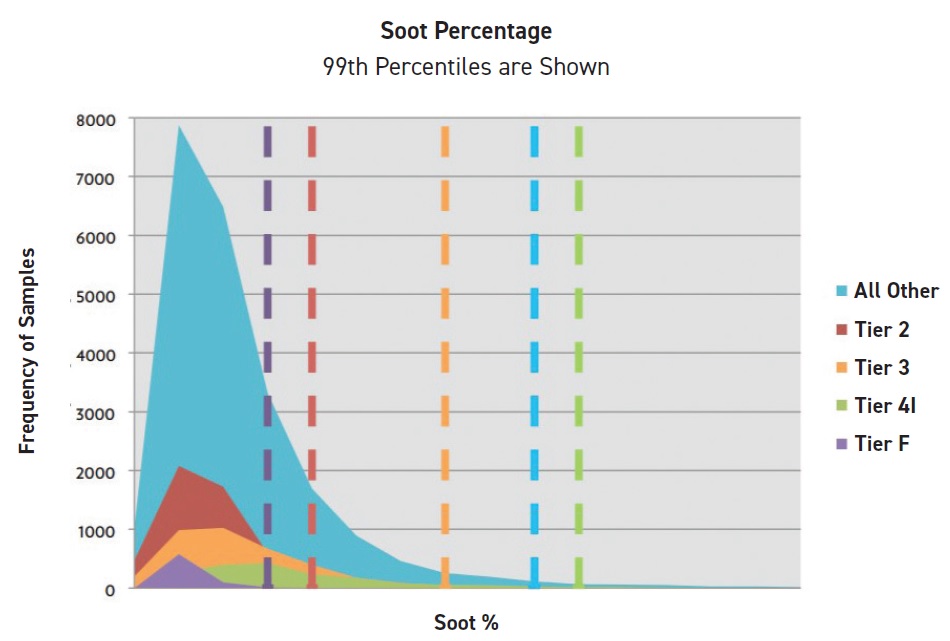
Figure 1. "Normal" diesel engine emissions differ across regulatory emissions tiers. The dotted line indicates the 99th percentile for the corresponding engine type with respect to soot percentage in the engine oil. Note the difference between Tier 2 (rust) and Tier 4I (green). Without the context of the emissions category to guide alarm limits, it could trigger a higher volume of alarm results. (Figure courtesy of Fluid Life, from Tier 4 Engines: How Tighter Emissions Regulations Are Changing Your Oil & What You Can Do About It, prepared by Robert Kalwarowsky.)

© Can Stock Photo / timofeev
Field Report: Is it the equipment?
“In about 2015, the heavy equipment industry that I am involved in saw the introduction of diesel engines that met the Tier 4 emissions standards. When we were first introduced to them, our sample results showed increases in copper, potassium and sodium and higher soot numbers (see Figure 1). In the beginning, I (along with all in the industry) saw it as a problem; however, we quickly realized that these changes were normal in a Tier 4 diesel engine.” —Darren Goll
Know your operating context
Finally, look beyond the component to the bigger picture—where and how the component is operating. Think broadly about what could be affecting the oil: operational demands, contaminants in the operating area—even the climate. “Temperature can sometimes have a pretty drastic effect on what is considered normal,” Eager notes.
Consider a sample from a component that’s very exposed to the elements, such as the final drive of a track-type tractor. “You might see a lot more dirt entry in a sample like that,” Eager explains. “Your acceptable level of silica or aluminum would be a lot different in an engine or transmission, where it would be a little bit more concerning to see a trend indicating dirt entry.”
Maintenance practices such as drain intervals also are a factor (see Best Practices). For example, increasing the oil drain interval on an engine could increase the iron content in the oil. However, an iron reading that used to signal abnormal wear might now be completely normal because of the longer interval.
Best practices
• Take the time to develop a robust baseline (more than a few samples) for each sampling program.
• Consult manufacturers and dealers for guidance on baselines—but don’t follow them blindly.
• Learn and practice trend analysis.
• Know your oil. Obtain a good reference sample (an unused sample of the exact oil used in operation).
• Know your equipment—in detail. Get formal training if possible.
• Take operation and maintenance practices—and changes in these practices—into account.
The magnitude of a change is meaningless without operational context. For a certain wear element, additive or viscosity, a 1%-2% change may be worrisome, but for another factor a 10%-15% change barely warrants a look. A minute change of 10-15 ppm in a wear metal like lead may be very concerning if the sample is from engine oil. A larger change of 50-70 ppm in iron in the same sample may be a negligible result. This is where understanding the specific equipment, environmental and operational factors becomes critical (see Field Report: Is It the Operating History?).
Field Report: Is it the operating history?
“In my early days as a heavy-equipment technician, I was tasked with troubleshooting diesel engines in their warranty period that showed elevated copper, lead and iron. With investigation, I quickly learned these levels were caused by leaching from a copper tube in an engine oil cooler.
“It turned out such results were seen in industrial diesel engines between the 2,000- and 4,000-hour mark; after that the levels would taper off to the expected normal values. I see many people new to the industry panic when they see these results and disassemble engines looking for a copper source that they will never find. This example illustrates that you need the facts about the component that the sample represents: for example, whether it is from a low-hour engine or from a new cooler that was installed on an engine with longer service.” —Darren Goll

© Can Stock Photo / kadmy
Take action
According to Darren Goll of CNRL Albian Sands, Fort McMurray, Alberta, Canada, “Trend analysis is the most important aspect of interpreting oil (and coolant) analysis results. Anyone can change all the oils at every service interval, but owners would all go bankrupt due to fluid costs!”
Newer oil and coolant formulations are very complex, and extensive research and development has gone into creating quality products for customer needs. The oil analyst must stretch the time between changes as long as possible to capture maximum cost savings and performance benefits from these advanced fluids.
Manufacturers or dealers can provide some guidelines for when to take action, but Eager emphasizes that they are only guidelines. “To find out what is acceptable, you just need to start sampling and find out what’s normal for your operation. Building that baseline is pretty important to understanding what’s an acceptable change over time,” Eager says.
Jane Marie Andrew is a freelance science writer and editor based in the Chicago area. You can contact her at jane@janemarieandrew.com.