Figuring out why things break down
Mary Beckman, Contributing Editor | TLT Webinars March 2019
Think of errors as a chain of events or series of linked holes.

© Can Stock Photo / Antikainen
KEY CONCEPTS
•
There are always multiple causes—physical, human and latent—leading to machine failure.
•
Systemic issues in design or management allow human practices to set up physical failures.
•
People are notoriously bad at estimating their own error rate and proficiency.
MEET THE PRESENTER
This article is based on a Webinar presented by STLE Education on April 4, 2018.
Root Cause Failure Analysis is available at
www.stle.org: $39 to STLE members, $59 for all others.
Neville W. Sachs, P.E., is a partially retired professional engineer. He graduated from Stevens Institute of Technology in Hoboken, N.J., with majors in mechanical and chemical engineering. Sachs was on the ground floor of the industrial Reliability Engineering effort. He formed SS&A in 1986 with a partner where he worked extensively with the Reliability Center, Inc. He is an active member of ASME, NSPE, NACE and STLE and holds the STLE CLS certification. You can reach Sachs at
nevsachseng@gmail.com.
 Neville W. Sachs
Root cause failure analysis interprets the features of a system or a component to determine why it doesn’t perform as intended. This could be a part, machine, operating area or entire plant. Using detective skills and a team of involved people, the key is to understand the physical, human and latent root causes of the inability to meet those goals.
Two influential authorities in root cause failure analysis are Charles Latino, one of the pioneers of industrial reliability engineering movement, and Dr. James Reason, a recognized expert in the area of human reliability (
1). Different practitioners of root cause failure analysis in industry might use different terms, but the approaches are generally similar.
The most important aspect of root cause failure analysis is that there can be no guesswork or opinions as to causes. Concrete facts have to support every decision that leads to the roots.
Multiple causes
There are three main types of root causes that build upon each other:
•
Physical roots. The actual physical mechanism of the failure.
•
Human roots. The human practices that allowed the physical roots to exist.
•
Latent roots. The way the site is managed and/or designed that creates the human roots.
Physical causes are the easiest to determine while the human and latent roots are not as easily recognized. However, finding and eliminating those human and latent causes has a far greater financial return.
In one example, a machine caught fire, caused a lengthy production shutdown and damaged the surrounding building. A simple failure analysis that solves the physical cause of the machine fire might prevent future fires and improve the reliability of that one machine. But a true root cause failure analysis that goes into the human and latent roots can eliminate whole categories of failures. It also hits your bottom line: putting the findings from a root cause failure analysis into practice often results in more than a thousand-fold return on the cost of the analysis, according to Neville Sachs, presenter of the Root Cause Failure Analysis Webinar.
Latent roots
Latent root causes arise from the way the site is managed or designed and permit the human root causes.
For example, this story about a crane whose cable broke shows how latent management practices contributed to the failure.
Sachs and a manager were investigating the failure of a broken cable that dropped a 30-ton vat of molten metal. While they were on the floor, where another crane operator and his spotter saw them, a second event happened. The crane operator picked up another 30-ton vat of molten metal while the crane was moving, contradicting one of the cardinal rules of crane operation (a crane should never be moving when initially picking up the load because the inertial forces combine to be substantially greater than just the weight of the load). That this happened in front of Sachs and management showed that unsafe procedures were routinely used and that management tolerated them.
Common latent failure roots include:
•
Having designers work outside their expertise such as mechanical engineers doing electrical design, chemical engineers doing mechanical design, not having a knowledgeable lubrication engineer in a largely mechanical plant, etc.
•
Not performing inspections when receiving maintenance items.
•
Not having regular workforce training.
•
Failing to recognize the importance of skilled employees.
•
Making the new (or lowest-rated) maintenance employee responsible for equipment lubrication.
Error chains
Untrained people rarely recognize there is always a chain of events with multiple contributors that leads to a failure or accident. There is a common tendency to solve the physical root of the problem and then wonder why the failure recurs.
Errors can be thought of as the result of a chain of events or a series of linked holes. Latino created chains of errors that lead to a failure or accident (
see Figure 1). Reason uses the example of rotating slices of Swiss cheese—the pieces represent errors and when the holes line up, there is an incident.
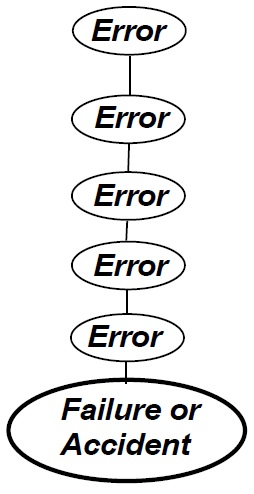 Figure 1. Charles Latino often spoke of error chains and how they lead to a failure or an accident.
Errors will eventually link and cause failures, but we don’t know exactly when or how often. Sometimes there is no incident if either luck or an observant person breaks the chain.
Root cause failure analysis of the crane that dropped the 30-ton vat revealed two very obvious latent causes and two human causes that led to the physical cause of a deteriorating cable (
see Figure 2).
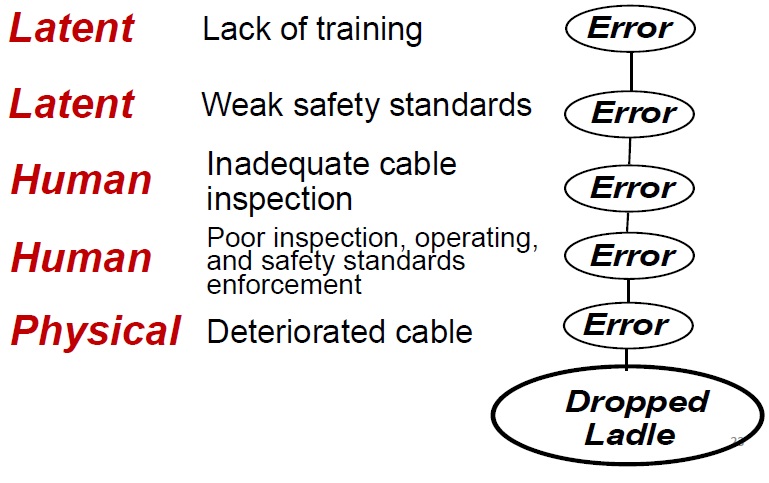 Figure 2. The crane that dropped the 30-ton vat revealed two very obvious latent causes and two human causes that led to the physical cause of a deteriorating cable.
Sometimes those errors don’t link up, and there is no failure or accident. At this site, a second bay was using the same process and not had a failure yet, probably due to luck.
Physical roots
The most important part of root cause failure analysis is accurately pinpointing the physical root causes. Because the physical roots lead to the human and latent roots, people must truly understand the physical roots of a failure if they ever hope to find the larger causes.
There are always multiple root causes—physical, human and latent. Detailed studies of some critical disasters reveal multiple causes in each case—physical, human and latent, such as:
•
RMS Titanic
•
The Halifax explosion
•
Bhopal disaster
•
Exxon Valdez oil spill
•
Chernobyl disaster
•
Deepwater Horizon (Gulf of Mexico) oil spill.
If the people doing the analyses don’t recognize there are always multiple causes, they will never reach an accurate conclusion. One example of this occurred at an international conference where two organizations analyzed the same data looking for the causes of some component failures. Their bar charts of the failure causes were informative but very different because they analyzed the failures as each having only a single cause. (In the discussion after one of the presentations, the speaker stated that he recognized there were always multiple causes, but the data source they were using didn’t allow for them to assign more than one.)
Multiple root causes
Experience shows that in all failures and accidents, there may be only one physical root, but there are always multiple human and latent roots. The number of roots typically depends on the complexity of the problem. For example, a simple industrial plant failure of something such as a pump or a fan usually has between four and seven roots. On the other hand, a complex system such as an aircraft crash generally has 12-14 roots, according to the U.S. National Transportation Safety Board (NTSB).
The number of root causes found also might depend on the depth of the analysis. Given its widespread importance to human safety, the NTSB has much more funding and time to analyze accidents. Unlike the airline industry, the goal of many root cause failure analyses in industrial plants is to get the plant up and running again. The problem with such cursory industrial analyses is the remaining unrecognized and uncorrected roots will come back to cause another breakdown.
Within the cost limits of any particular analysis, the goal of your root cause failure analysis program should be to break that error chain and eliminate as many roots as possible (
see Figure 3). Often, with some close attention, some of the root causes can be eliminated at no to very low cost.
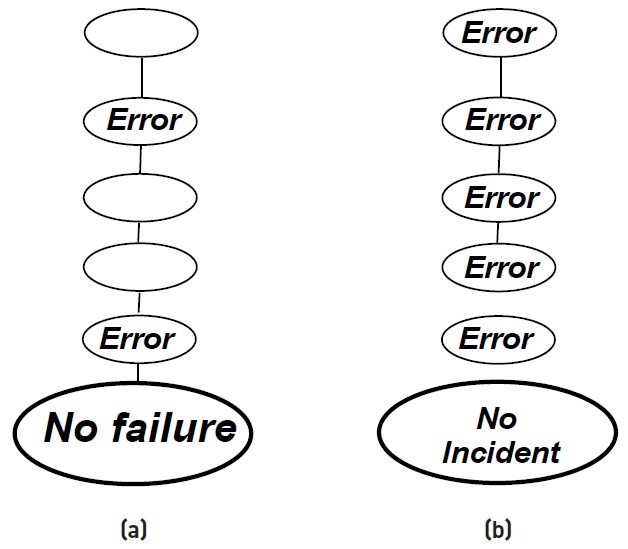 Figure 3. (a) Break the error chain or (b) get lucky. Either luck or an observant person breaks the chain.
Physical and human roots
Figure 3. (a) Break the error chain or (b) get lucky. Either luck or an observant person breaks the chain.
Physical and human roots
A study of over 120 detailed failures, looking at just the major human and physical failure causes, found the following averages (
2). The most common type of human error is in design:
•
Physical roots—1.4 errors/failure, with many of them involving fatigue and corrosion
•
Human roots—multiple roots of these types:
o
design errors (59%)
o
maintenance (38%)
o
operating (24%)
o
installation (16%)
o
manufacturing (12%).
In this example (
see Figure 4), a variable speed turbine is driving a reciprocating compressor through a reducer. This setup resulted in multiple failures due to two types of vibration: torsional and translational. A major design error was that the specifying engineer did not consider what resonant frequencies the bearings in the gearbox were sensitive to. After repeated failures, they decided to only operate the turbine at specific speeds.
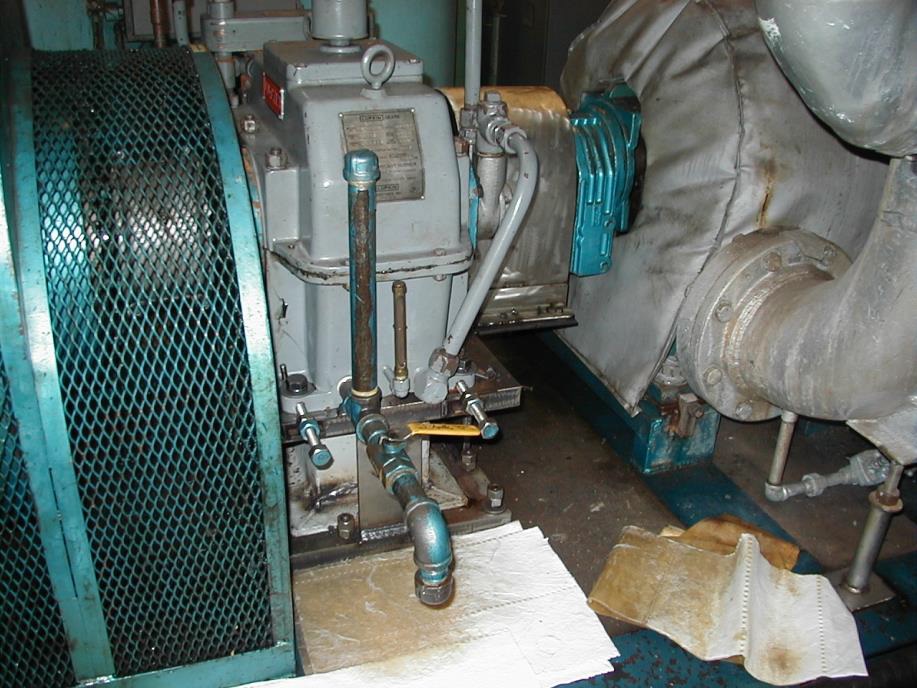 Figure 4. An example of a design error.
Human errors
We all make mistakes. But how often do you think the average person makes a significant error? (A significant error is one that could lead to the need for medical treatment or results in a substantial financial loss.) The probability of an accident goes up when a person talks on a cell phone while driving a car or truck. The chance of falling goes up when you don’t use a handrail when walking down stairs.
Based on the Handbook of Human Reliability, Chemical Engineering Magazine reported these error rates for work-related activities (
3):
Industrial activities
•
Critical routine task: 1/1000
•
Non-critical routine task: 3/1000
•
General error rate for high stress rapid activities: 1/4
•
Non-routine operations (startup, maintenance, etc.): 1/100
•
Checklist inspection: 1/10.
General human error
•
of observance: 1/50
•
of omission: 1/100.
Elevated personal opinions
Latino often quoted Dr. Reason as saying the average person makes six significant errors per week, requiring medical treatment or financial loss. But plant surveys Sachs has conducted since 1993 show the typical person
thinks they make a significant error only once every five months.
Sachs’s surveys of over 3,000 personnel, typically from maintenance, engineering and plant supervision, found the average person rated themselves as above average and their coworkers below, even though the average person is by definition at a 50% skill level:
•
Own skill level: 72%.
•
Co-workers made twice as many errors.
•
Less than 1.7% of the 3,000—50 people—said their skill level was below average.
•
Only one ever, since 1993, said they were below average in safety awareness.
A good root cause failure analysis program can reduce errors and improve savings. Sachs says two typical examples include a plant where, over eight years, managers cut the number of motors they had to replace per year from 500 to 250. The reduction in replacement costs amounted to 50 times the investment and didn’t include the effect on lost production, that the maintenance staff can be smaller or that product quality improves because of more consistent runs.
The second example was a pharmaceutical plant that cut, over four years, maintenance costs from $115/hp to $60/hp for motors in use. They also cut pharmaceutical product loss due to equipment failures by 60%.
How to do analysis
The first thing that is absolutely required is management support that is committed and lasting. Results will need to be carried through, and without management behind that activity the analysis is a waste of time and possibly money.
Second, select the topic to be analyzed, which can be very easy if something’s broken but more complicated for a division or department within a company. In the division or department cases, start at the highest level you can. But for a broken machine, you can start by just listing all the visible physical damage—in other words, the observed items or conditions.
Third, create a diverse, unbiased team with a leader or coordinator who can guide the team toward perceptive questions.
Fourth, use a logic system to understand the interaction of causes. Finally, guard against opinions or prejudices governing the outcome, especially single dominant persons taking over the analysis.
Choose analytical method
Logic trees are simple and good for getting in-depth analysis. They are an easy-to-follow technique both for the participants and to present results to others such as management.
According to Sachs, he has found that other methods such as 5 Whys, Fishbone diagrams and Kepner-Trego are not as effective or efficient in finding the true root causes and generally not as easy for others to understand.
Figure 5 shows a logic tree for the analysis of a catastrophic failure in a paper mill where a 3,000-hp wood chipper that eats logs at a foot per second failed dramatically. This will serve as an example to go through the process. Initially the woodchipper displayed a dozen broken or failed parts or conditions, noted in the yellow level in the logic tree.
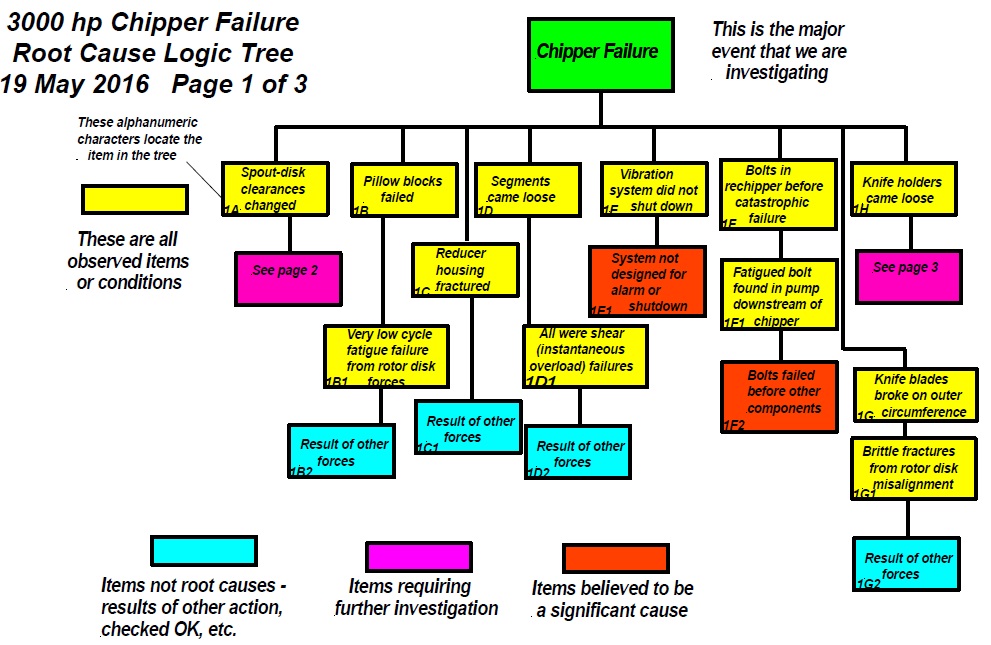 Figure 5. Root cause logic tree.
The coordinator and team
Figure 5. Root cause logic tree.
The coordinator and team
The coordinator is a critical job. The coordinator chairs the meetings and acts as the moderator. Although the coordinator doesn’t have to understand the problem area, a general idea of how things work will make the job easier.
The coordinator’s key job is that of a detective driving an investigation. He or she helps the team ask questions about how an event or a feature could happen and ensure the answers are based on fact or a true expert opinion.
The coordinator is responsible for team communication, including developing, organizing and presenting the latest charts, data and assignments.
The five- to 10-member analytical team should be drawn from a wide range of the disciplines and departments involved. Although the coordinator leads the team, all team members should be viewed as equals.
Logic trees
Commercial software is available to develop and present logic trees, such as the Reliability Center’s PROACT (
4).
The coordinator inserts the failure or selected starting point into the top box on the logic tree chart. The next level shows all the detectable features.
With system problems, it is more difficult to pick out a starting point. For example, with a plant that isn’t producing well, you might start with an analysis of the optimum production capacity. Then look at each item or event that restricts that capacity. Next, draw a Pareto chart outlining the effect of those causes, which provides a good visual to start with. Begin root cause analysis on the most expensive, from either time or cost restriction. When that is solved, the team would move on to solve the cause of the next most expensive, and so on.
The chipper
Figures 6 and 7 show the chipper being analyzed for this logic tree example before the failure and after. Logs are fed in at the spout at bottom right. Two motors drive the gearbox, which turns a shaft, which spins the chipper disk. The chipper disk is a 130-inch flywheel with knife blades on it.
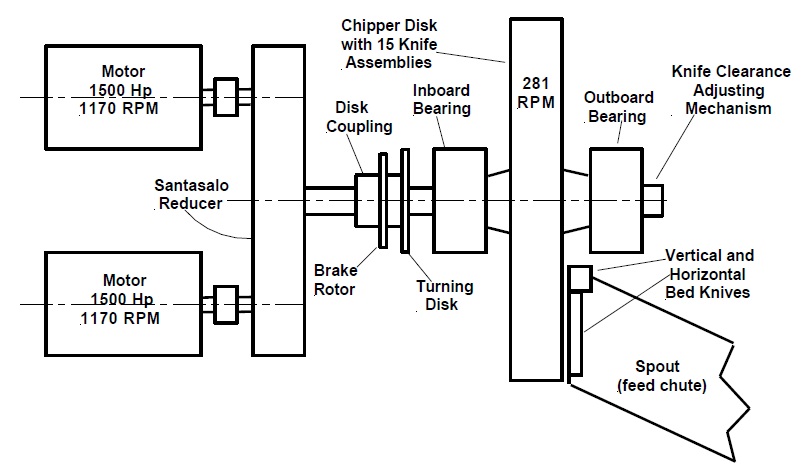 Figure 6. The chipper before the failure.
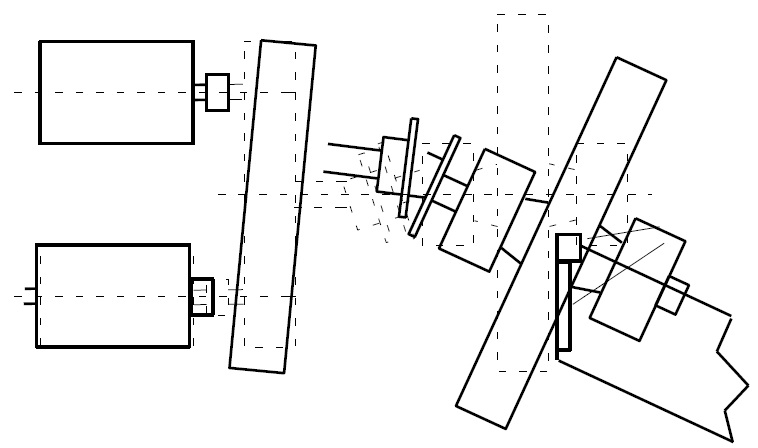 Figure 7. The chipper after the failure.
In the massive failure, the chipper disk crushed the chute, which was made from two-inch thick steel.
The chipper analysis team
•
Two maintenance craftsmen
•
Maintenance supervisor
•
Operator
•
Operations supervisor
•
Operations superintendent
•
Plant reliability engineer
•
Plant reliability engineering supervisor
•
Outside consultant.
Conducting the analysis
First, protect the parts from contamination. Then spread them out over an area—be it a table or warehouse—so the team can inspect them. The coordinator starts by asking the group, “How can this event (or symptom) happen?” Add every suggestion to the tree, even if it looks ridiculous. Then look for answers. The answers—those answers have to be supported by facts, not opinions. Keep everyone involved. Assign duties for needed information that comes up during the discussion.
Creating the logic tree
Sticky notes are an easy way to begin to build the logic tree. Different colored sticky notes or pen colors can help build levels in the tree. Institute a numbering system on the sticky notes or boxes to keep track of the connections between levels.
Don’t be discouraged by the first draft. Although the plan is to make it look like Figure 8, it usually starts out looking like Figure 9.
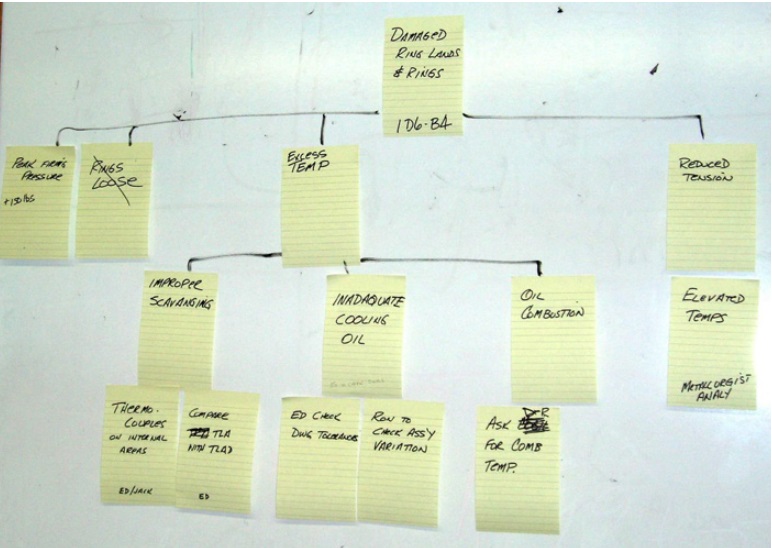 Figure 8. Sticky notes are an easy way to begin to build the logic tree. The plan is to make it look like this.
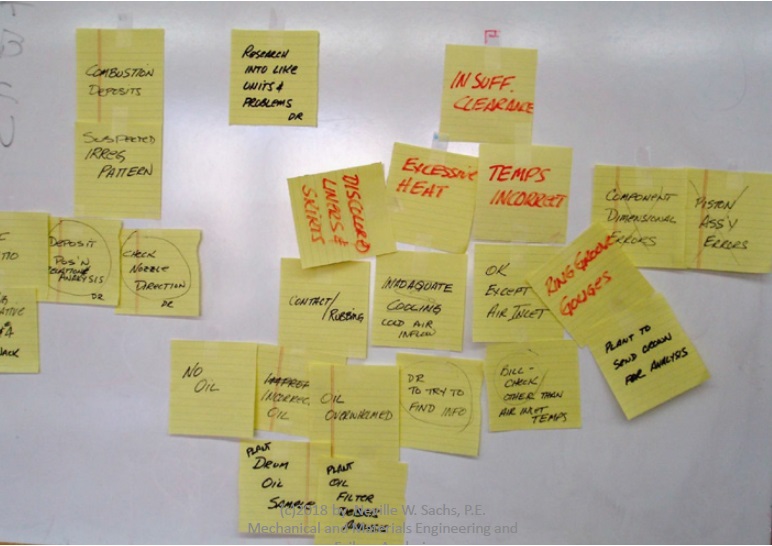 Figure 9. The logic tree with sticky notes usually starts out like this.
The coordinator then organizes the tree and presents it at the next meeting. Continue to meet until the logic tree is complete, makes sense and provides satisfactory root causes all the way back to human and latent roots.
In the case of the chipper (
see Figure 5), the team determined the physical cause was fatigue on bolts, a very common root cause. One of the latent root causes was in design where the bolts couldn’t be tightened adequately. Another involved trying to use a stamped part that couldn’t meet the tolerances needed. Other human and latent roots included the fact that management had eliminated engineering reviews of machinery revisions because they thought it was an unnecessary step in the process; also, some sensors were disconnected because of “too frequent” alarms.
Things to avoid
A dominant person’s attempt to take over the process can affect the quality of the logic tree and the resulting root causes. Often there will a person with an official—or unofficial—leadership position who will try to control the process, whether inadvertently or on purpose. The coordinator must then ask the person to let the others participate more.
Secondly, to eliminate latent roots, a champion is needed to follow up with management and effect change in the way the site is operated.
Lastly, don’t be afraid to talk to a pro. Outside experts can offer insight that team members might be unaware of.
REFERENCES
1.
Latino, M.A., Latino, R.J. and Latino, K. (2011),
Root Cause Analysis: Improving Performance for Bottom-Line Results, Fourth Edition, CRC Press: Boca Raton, Fla. ISBN: 9781439850923.
2.
Petersen, J.L., ed. (2002), “Understanding the Multiple Roots of Failures,”
Reliability®,
8 (6). Published by Industrial Communications, Inc., Knoxville, Tenn.
3.
Swain, A.D. and Guttman, H.E. (1983),
Handbook of Human Reliability Analysis with Emphasis on Nuclear Power Plant Applications (Sandia National Labs NUREG CR-1278), Washington, DC: Nuclear Regulatory Commission. Available
here.
4.
Reliability Center, Inc.:
www.reliability.com.
Mary Beckman is a free-lance science writer based in Richland, Wash. You can contact her at mbeckman@nasw.org.