Oil analysis past and future
Jeanna Van Rensselar, Senior Feature Writer | TLT Feature Article April 2018
Each milestone paves the way for advancements in sampling techniques, data analyses and timeliness of reporting.
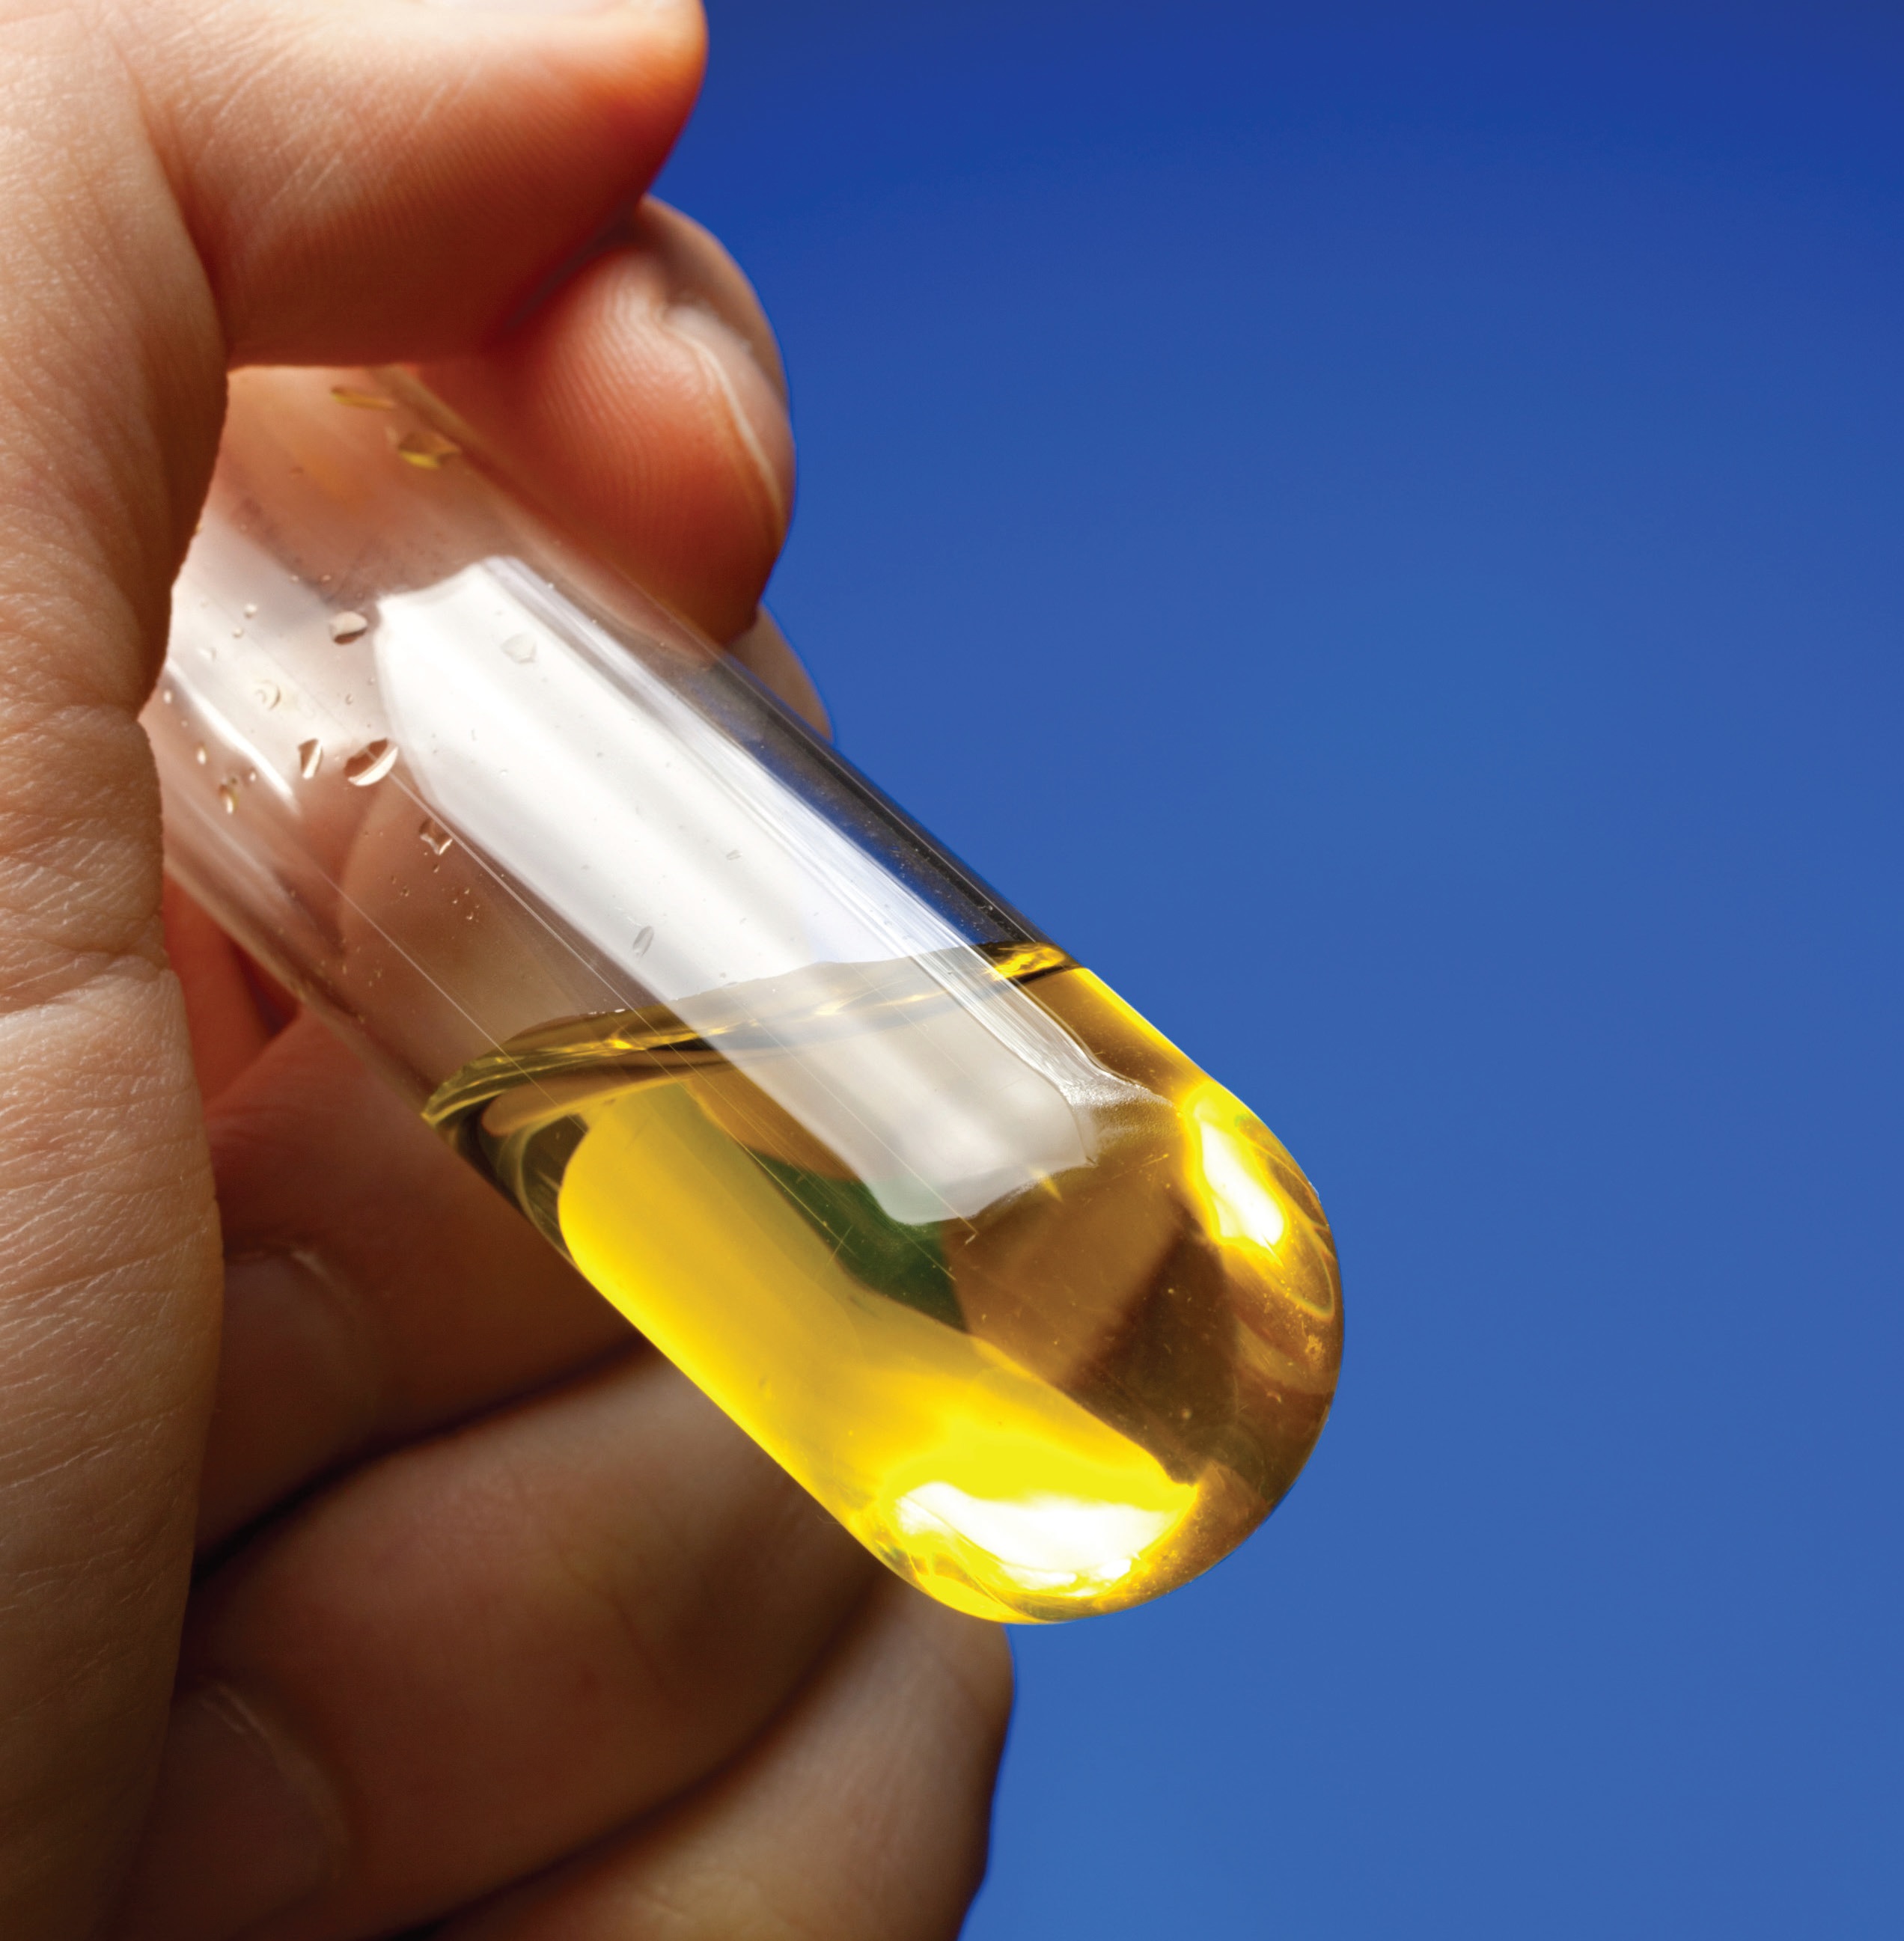
© Can Stock Photo / Garsya
KEY CONCEPTS
•
Although soaps and oils for lubrication have been around since the 17th Century BC, oil analysis has been in use for about 80 years.
•
Computers and the Internet enabled the biggest advancements in oil analysis.
•
The next paradigm shift in oil analysis will be embedded sensors.
Oil analysis has been in use since the early 1940s and was immediately accepted as a critical tool for determining the health of machinery. What has changed are the capabilities, the accuracy of the analyses and the time and means of transporting results. Also, there are now complementary condition monitoring technologies such as vibration monitoring, thermography and ultrasound.
Darren Goll, mobile maintenance, reliability fleet condition monitor, Albian Sands Muskeg River Oil Sands Mine, Canadian Natural Resources, Ltd., says, “When I started my career in the 1980s, most diesel engines required much periodic maintenance. Most transmissions required clutch mid-life change-outs and resealing, and many final drives needed mid-life bearing and seal change-outs. Hydraulic systems had mostly gear pumps with low life expectancies. Today’s engines, transmissions, final drives and hydraulic systems are more complex, more expensive and require little or no maintenance; they don’t need to be opened up. This technological improvement meant we required another method to determine the internal component condition to the end of usable life. Oil analysis was an efficient solution for looking inside and monitoring wear trends, tracking and illustrating trend ranges from normal wear characteristics to abnormal wear and catching parts failures early so that we can make repairs and extend the lifecycle.”
The genesis of oil analysis (1)
While the history of lubrication dates back 3,700 years, the widespread use of oil analysis to determine the condition of the oil, and later the equipment, began in the 20th Century.
The 1940s. Systematic oil analysis began in the late 1940s. Early applications were geared toward avoiding catastrophic and costly failures of operating equipment. It was first used after World War II by U.S. railroads to monitor the condition of locomotives via wear metal analysis. Bench testing was performed by chemists, one metal at a time.
In 1946 the Denver and Rio Grande Railroad research lab detected diesel engine problems through wear metal analysis of used oils. Key to the success was the development of the spectrograph, which replaced wet chemical methods for detecting and measuring individual chemical elements. This practice was quickly accepted and used extensively throughout the railroad industry.
In 1946 Walter Baird invented the direct read emission spectrometer, capable of analyzing dozens of elements at once and requiring no background in chemistry to operate. This represented a major shift in oil analysis and ushered in machine analysis. Most companies involved in oil analysis used either an atomic absorption spectrometer or an atomic emission spectrometer (
2).
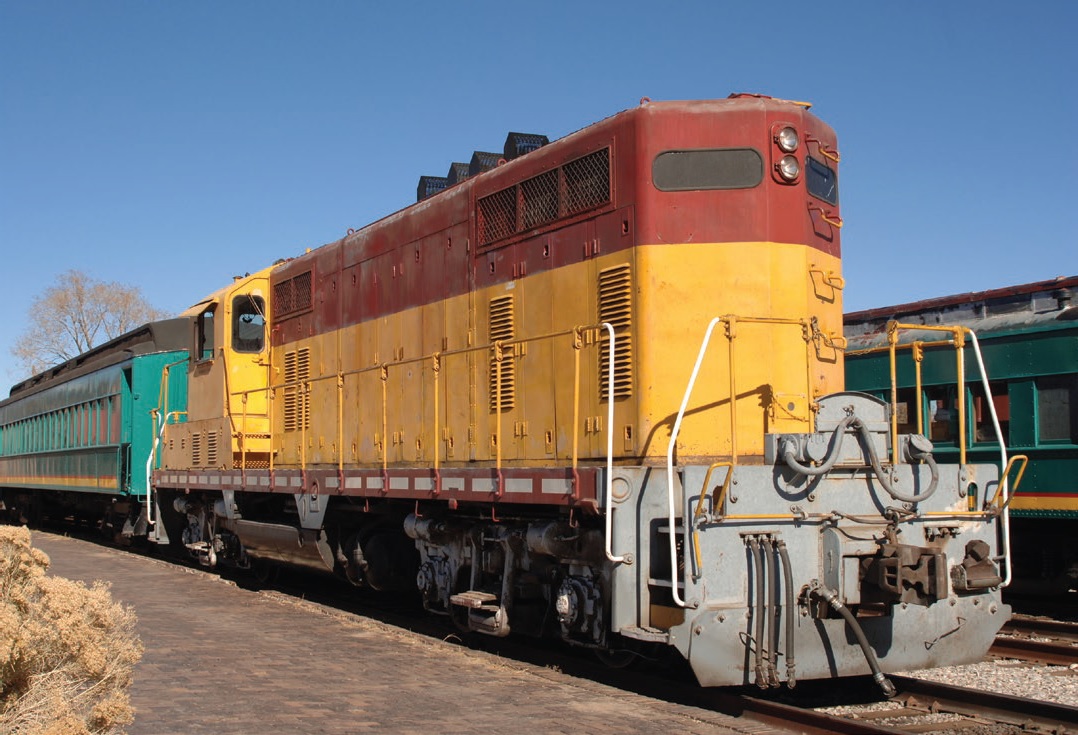 In the 1940s railroads detected diesel engine problems through wear metal analysis of used oil.
© Can Stock Photo / jgroup
The 1950s. Success in rail engines prompted the U.S. Navy to begin experimenting with used oil analysis using spectrometry on ships and aircraft engines (additional successes by the Navy led to the U.S. Army adopting this form of analysis in the 1960s) (
see Oil analysis in the Army). Around this time Rolls-Royce also was experimenting with oil analysis on jet turbines. Comprehensive oil analysis programs were developed by the U.S. Army and Air Force.
Oil analysis in the Army
The Army Oil Analysis Program (AOAP) is a maintenance tool that provides diagnostic services to the Army and other armed services worldwide. Ironically AOAP began in 1961 after several defective Army helicopter transmissions were detected by an existing Navy oil analysis laboratory through oil analysis.
The Army recognized that oil analysis could be a valuable maintenance diagnostic tool, so it opened its first oil analysis laboratory at Fort Rucker, Ala., in September 1961 to provide support for its expanding aeronautical fleet. On the laboratory’s first day of operation, a defective aircraft engine was identified through spectrometric wear metal analysis.
Initially AOAP was all about readiness to ensure that equipment was ready to be deployed to any location in the world.
Between 1961 and 1975, oil analysis was used exclusively to monitor aeronautical components. In 1975 AOAP’s capabilities were expanded to include ground combat equipment. The program’s expansion to ground equipment meant that AOAP also would need to perform analytical tests capable of determining lubricant condition. In 1977 tactical and wheeled vehicles were added to AOAP’s workload, with other Army systems including locomotive, construction, materials handling, support and generator end-item components.
Today this equipment is monitored by 25 AOAP laboratories (23 fixed facilities and two mobile labs) and joint laboratories worldwide. Together, the labs analyze more than 1.1 million samples per year, recommending services and maintenance. The Army estimates that cost savings total millions of dollars annually in equipment maintenance, replacement of internal oil-wetted components and labor and materials costs (
3).
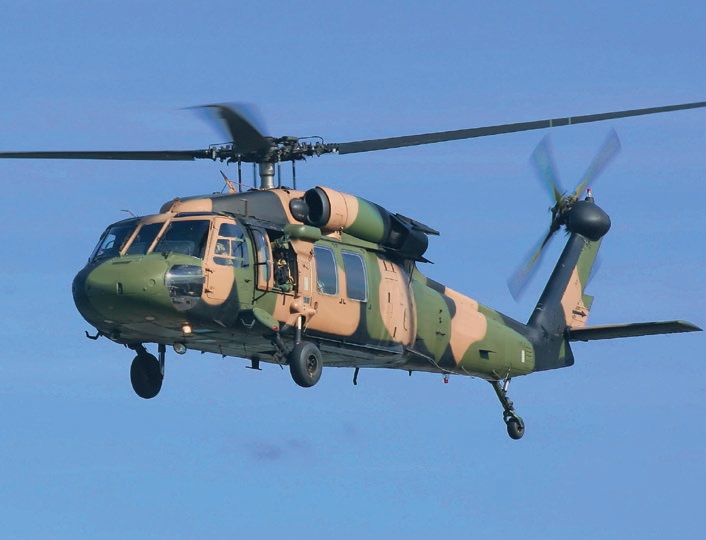 © Can Stock Photo / jabiru
The 1960s. The U.S. Army and Air Force generated reports manually, and a data analyst interpreted the data with codes. Most reports were copied and mailed, with critical reports phoned in. As oil analysis became increasingly mainstream, there was a demand for more expeditious processing.
Shane Elzinga, product support representative, Kearl Oil Sands Project, says, “Originally the oil sample results were printed on paper and sent by mail. As technology improved the same individual samples were emailed via PDF attachment. Now the sample reports are Web based. Having good information in a timely manner supports a sustainable condition-based monitoring program.”
The 1970s. Oil analysis now included wear metals, viscosity, contamination and degradation testing. Together these tests were reasonably complete and provided adequate information along with value. The primary shortcoming was the ability to detect particles less than five microns. The biggest struggle was managing large amounts of data manually. It was relatively easy to discern trends, but detailed comparisons of large data sets required a significant amount of time and complex calculations. Computers were first introduced in the lab toward the end of the decade.
STLE-member Charles Gay, CLS, OMA, senior data analyst for Bureau Veritas in Atlanta, says, “The integration of computers and the Internet has been the greatest advancement in oil analysis technology. The ability to communicate in the form of sending data, perform presentations, provide training and an overview of a customer’s test data in real time has been a phenomenal improvement.”
Elzinga says, “With an online database, trending, component and fleet analysis are possible without having to manually enter a lot of data. This can provide timely, useful and actionable information to manage equipment, and this information can be easily and immediately shared with others.”
The 1980s. Routine large particle sizing and counting came onto the scene but still was unable to detect particles smaller than five microns. Also, this system didn’t distinguish between particulate nature; it only sorted, sized and counted.
Despite this, the 1980s was the decade of professional oil analysis. Regional laboratories began to thrive, and larger oil analysis firms opened additional locations in an effort to cover a wider geography with faster turnaround. To that end, oil analysis reports were faxed for the first time.
Goll explains, “When I started my career in the 1980s, usually only large companies used oil analysis, then more and more smaller companies and owner/operators realized the value-added use of oil analysis to control operating costs.”
STLE-member Don Sedrovic, customer service advisor for Finning Canada, says, “Early in my career (around 1980), I was an apprentice heavy-duty mechanic for a large coal mining company. There were no reliability or condition monitoring departments back then; the maintenance team may have had one engineer, if any. Oil analysis was the new thing in our area, and sample results were often returned to clerks or planners to decide if action was needed. It was hit and miss at best.”
The 1990s. Parallel techniques such as analytical ferrography allowed more comprehensive inspection, often including some form of metallurgy. Analytical ferrography also crossed the five-micron particle threshold and opened the door for preventive and predictive maintenance.
“As a field mechanic in the late 1990s I was exposed to the concept of improving oil cleanliness via the application of contamination control tools and processes,” Sedrovic says. “This was when I first saw portable particle counting and kidney looping at work down on the shop floor. At first we only looked at bulk storage systems, but before long we were connecting to machines and taking live samples of hydraulic and powertrain fluids. Most important to me was the fact that you could see the particle numbers drop as the oil was filtered over time. It was visible evidence that the system was working as it should. This tied the technology to the work!”
2000s and beyond. More exotic testing such as scanning electron microscopy came into being. Today’s oil analysis program is a tried and true suite that includes wear metals, contamination and degradation tests, general particulate analysis and wear particulate analysis. Many of these technologies are now addressed in ASTM standards.
Matt McMahon, senior data analyst for TestOil, says, “Some hallmarks of a successful oil analysis technology would be good repeatability of data, ability to run the test on many different products with meaningful results and acceptable costs. I believe having the technology covered under ASTM standards helps, since customers can be assured that the method/technology has been documented/vetted. Over the years we’ve added numerous tests to our lineup.
“I think the most significant area of coverage is in the realm of varnish testing,” McMahon adds. “Before that point I would occasionally receive phone calls from customers mentioning that they had a varnish issue, but the traditional oil analysis tests were not in alarm. With the addition of tests such as ultracentrifuge, membrane patch colorimetry and RULER, we have a lot more tools to work with in order to find the root cause of varnish issues.”
All of this is paving the way for sensor technology.
“The next generation of oil analysis equipment reliability tools, I believe, will be electronic live sensors monitoring wear particles in the oil path flow on the component—giving wear particle size, amounts and types,” Goll says. “You know exactly when to change the oil based on condition. This offers the opportunity to prevent machine failures as well as to prolong maintenance and oil change intervals by means of appropriate measures.”
Gay concurs, “The future of oil analysis ultimately will be inline detectors for oil condition, vibration and temperature data fed to a software program that evaluates the inputted data, determines what abnormal condition exists, informs maintenance management and sends a work order to correct the condition detected.”
Sensors: The bridge to the future
Systematic improvement and weight and size reductions in the instruments used for analysis has been gradual, but sensor technology would not be possible without it. Sensors are essentially the miniaturization of bench-top instrumentation with few or no moving parts. Sensors are being designed to overcome the traditional obstacles to offline oil analysis such as time, comprehensiveness, continuity, contamination and eventually cost.
The first popular sensor was a small, portable dielectric constant device modeled after larger units used in transformer oil testing. Like the first analytical instruments used for oil analysis, sensors initially had problems with sensitivity, accuracy, dependability and verification.
Today’s embedded sensors emit dielectric strength readings revealing small differences that can be observed and correlated to oil properties. They address viscosity, water, particle count and ferrous debris. However, additive depletion, fuel and most metal and nonmetallic contaminants cannot be differentiated just from the sensor’s output. Labs are still needed to provide testing to supplement sensor observations. On the horizon is the ability to detect complex differentiation of particles in terms of metallurgy, shape and quantity.
The major hurdles to widespread adoption of sensors are capabilities and cost. However, sophisticated sensor systems are already cost-justified for expensive and/or difficult to access machinery such as commercial aircraft, spacecraft, large marine vessels and wind turbines.
Right now, there are two types of sensors being developed: real time and near real time.
•
Real-time sensors continually monitor the state of lubricants. They use a variety of techniques to determine lubricant condition and are placed either directly in the system flow or in a flow branch. They can be connected directly to monitoring systems to allow for continuous real-time monitoring and diagnostics.
•
Near real-time sensors bring laboratory procedures onsite to allow for quicker response time. Some near real-time systems still require oil sampling. The advantage is that tests only take a matter of minutes to complete. Some near real-time systems can be connected to monitoring systems for lubricant diagnostics and prognostics.
At some point in the near future, OEMs will routinely install sensors or mechanisms for aftermarket retrofit on all equipment that leaves their facility.
Bryan Debshaw, CEO of POLARIS Laboratories, says, “Combined with Internet of Things (IoT) (
4) connectivity, these sensors can trigger alerts quickly and prevent further damage. While that sensor technology isn’t able to replicate the fluid quality evaluation that comes with a full suite of laboratory testing, it will alert users to rapidly progressing failures and prompt further investigation (such as fluid analysis). Linking integrated technology to data results collected by the laboratory via IoT will allow data analysts to eliminate guesswork, confirm suspicions and make more precise recommendations than what is possible today.”
The future
Once certain aspects of analysis become sufficiently miniaturized and cost-effective to support sensors, the following substitutions for laboratory testing may take place: soot, water, fuel dilution, oxidation, nitration, contamination, viscosity, particle count, additive depletion and ferrous debris. Experts say it may be more than 10 years before this happens.
In the future, oil analysis labs will increasingly specialize in areas where sensors fall short. For example, some applications such as gearboxes will not be candidates for sensors anytime in the near future, as will anything that requires spectrometric or microscopic metal analysis. Diesel engines where high heat, vibration and soot in the oil make it impossible for sensors to get an optical field through the diesel engine oil, are also not candidates for sensors. Oil analysis labs will provide a key role in verifying sensor data and developing more sophisticated tests—many of which can never be performed by sensors.
“Technology shouldn’t be added just to stay on the cutting edge,” Debshaw says. “It has to have a purpose and add value to the maintenance program. That’s the standard for new technology: Are the benefits of adopting new technology worth the work of acclimating your team to the new process? Additional hurdles include providing a universal user experience and an intuitive interface. Apps are great examples of this. They don’t come with owners’ manuals, so they have to be able to be picked up easily and comfortable to use every day. In order for technology to be successful and adaptable, this requires behind-the-scenes support to maintain the system so it stays current and continues to meet user needs and expectations.”
McMahon says, “I think the primary factor that will affect the future of oil analysis will be continued advances in computer technology—anything from increased use of handheld devices to track samples and results to increased computing power for advanced analysis and data mining. Handheld devices just continue to get smaller and smaller while continuing to increase in capability.”
Elzinga believes condition monitoring will become significantly more comprehensive. “I think oil sample analysis has always had a high degree of acceptance, but how the sample was taken from the machine has been questioned at times. Going forward, oil analysis will be part of everyday actionable information. The oil analysis could be on the machine and continuously monitored for real-time analysis and exception reports. It also can be tied into other events or conditions that may require attention such as electrical or mechanical faults or issues as well as operational events. This type of oil analysis will simply make better use of infrastructure including operations, service and procurement. It also will allow time to ensure that parts, bay space and manpower for repairs are available.”
In the end
Sedrovic concludes, “My last thought on technology is this—please remember that technology is a tool; it still requires the mind, heart, effort, intuition and vision of a person to do the work of integrating it into the business. Without the people, the technology will stagnate and plateau quickly. Select your technology, do the work to understand it and get good at it, embed it in your workplace, challenge the people to use it and improve it.”
Adds Gay: “Overall the greatest advancement in this industry has been the increase in knowledge about fluid testing and use of the data obtained from the analysis. We used to spend more time explaining what we were doing and why, including what the testing means and how to read the reports, than using our abilities to do the task we were supposed to do. STLE and its members have played an important part in tribology education.”
REFERENCES
1.
Portions of information in this section are from the following sources:
•
WearCheck Technical Bulletin: Issue 18 - Conditioning Monitoring, Oil Analysis & More. Available
here.
•
History of Oil Analysis, WearCheck. Available
here.
•
Johnson, M. (2007), “Oil Analysis Part I: Past, Present & Future,” TLT,
63 (5), pp. 32-39.
•
Johnson, M. (2007), “Oil Analysis Part II: Past, Present & Future,” TLT,
63 (6), pp. 32-39.
•
The History of Oil Analysis, by Jack Poley. Available
here.
•
Oil analysis, from Wikipedia. Available
here.
•
Isel: A Brief History of Lubrication. Available
here.
•
Engineering Maintenance Solutions: The History of Oil Analysis. Available
here.
2.
The History of Oil Analysis, by Jack Poley. Available
here.
3.
From Transforming Oil Analysis by Captain Daniel A. Jensen. Available
here.
4.
IoT is the connection between embedded computing devices (such as sensors) to the Internet enabling these devices to send and receive data.
Jeanna Van Rensselar heads her own communication/public relations firm, Smart PR Communications, in Naperville, Ill. You can reach her at jeanna@smartprcommunications.com.