Lighting up the contacts
Drs. Wilfred T. Tysoe & Nicholas D. Spencer | TLT Cutting Edge April 2018
Fluorescence methods allow the real area of contact to be visualized—and show where Amontons’ Law fails for polymers!
In a previous column we discussed how fluorescence measurements can show how viscosity varies during EHL lubrication (
1). Now another fluorescence-based technique has been applied to reveal the real area of contact during both static loading and sliding experiments (
2).
The cleverly designed molecule (
3) shown in Figure 1, when anchored via silanes onto a glass surface, has the interesting property of fluorescing when the internal rotation of the molecules is hindered upon confinement. In other words, as soon as the separation between the coated glass and a counter surface decreases to about the size of the molecule’s diameter, it fluoresces.
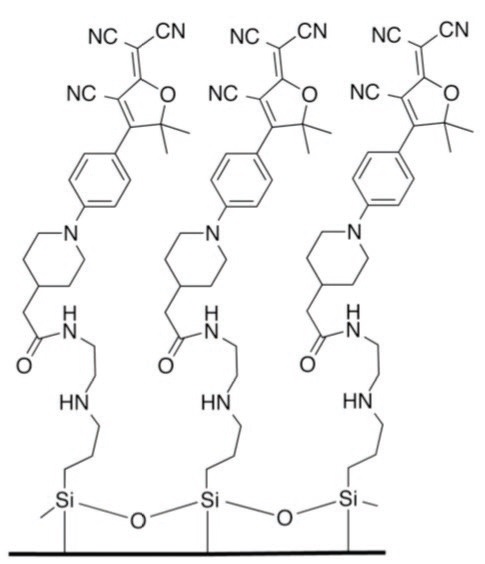 Figure 1. Immobilized molecules that display confinement-induced fluorescence. (Reprinted from Wiley-VCH Verlag GmbH & Co., Weinheim (3).)
Professor Daniel Bonn, with his colleagues Bart Weber, Tomislav Suhina and Albert Brouwer at the University of Amsterdam, Netherlands, in collaboration with Till Junge and Lars Pastewka at Karlsruhe Institute of Technology in Germany, have used this fluorescent system to examine the real contact area of a roughened polystyrene (PS) sphere pressed against glass under both static loading and sliding conditions. By following the total fluorescence intensity, the researchers were able to monitor the total contact area (
see Figure 2a) and compare it to that expected from calculations based on different theoretical approaches, all of which used atomic force microscopy (AFM) roughness data from the sphere as input.
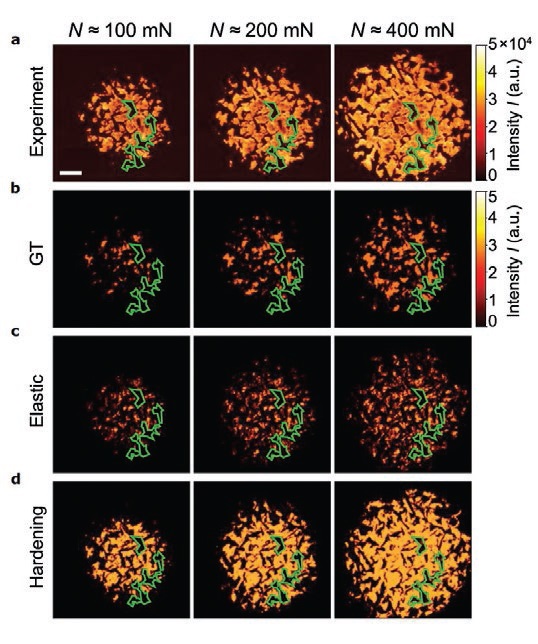 Figure 2. Real contact area between a rough polystyrene sphere and a smooth fluorescent-molecule-covered glass surface measured and simulated at increasing loads. (a) Fluorescence-intensity images of the contact geometry. The average contact pressure rises from roughly 100 MPa at the beginning of the experiment to 250 MPa at the highest loads. Scale bar, 10 µm. (b) Elastic Greenwood and Tripp (GT) bearing area calculation. (c) Purely elastic simulation. (d) Elastoplastic contact-hardening simulation. Green lines indicate contact edges in the experimental images. (Reprinted from Springer-Nature (2).)
A model that used independent multi-asperities (Greenwood-Tripp,
Figure 2b) significantly underestimated the real contact area, while a full numerical Green’s function method (
see Figure 2c), which treats the elastic interaction exactly on all length scales, approached the experimental result more closely but still failed to reproduce it. Only by including the effects of plasticity and strain hardening (
see Figure 2d) could the experimental results be reproduced (
see Figure 3a). AFM measurements were also made after the loading experiment and confirmed that plastic deformation had, indeed, taken place at the most prominent asperities.
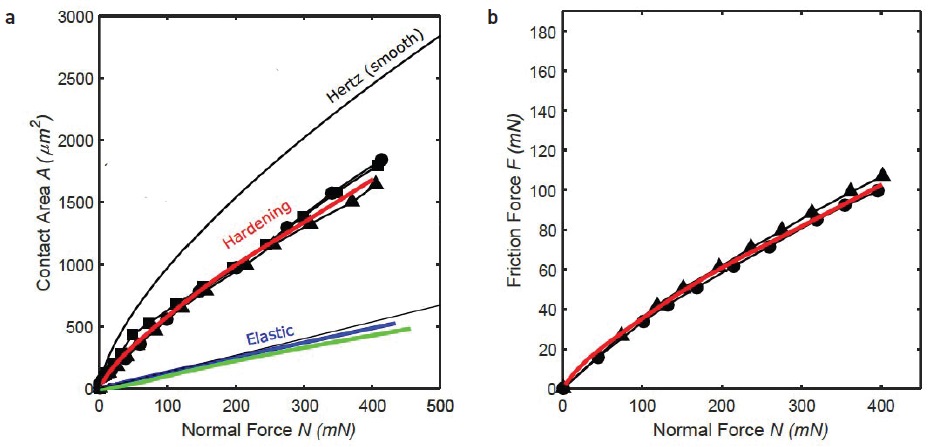 Figure 3. (a) Real contact area versus normal force. Symbols show experiments on three polystyrene (PS) spheres that have similar roughness. Solid lines show values obtained from Hertzian (smooth-sphere) theory, as well as those based on pure elasticity, and using a hardening model. (b) Static friction force of contacts like those in (a), measured at different normal forces. Symbols show experiments on two PS spheres, the red solid line being the hardening simulation fitted onto the friction data by multiplication with the interfacial shear strength. The agreement shows that the static friction force is proportional to the contact area, but the clear non-linearity shows that Amontons’ Law is not obeyed for this system at significant loads. (Adapted from [2] by kind permission of Springer-Nature.)
The measured static friction between the PS sphere and the glass surface was found to be reproduced well by the hardening simulation (after multiplying by an interfacial shear strength) and demonstrates that the friction force is, indeed, proportional to the contact area. However, as is often the case for polymeric systems, Amontons’ Law is not obeyed at significant loads, as can be clearly seen from the non-linearity of the friction-load plot (
see Figure 3b).
This work shows how new weapons in the experimentalists’ arsenal for observing fundamental tribological processes on the microscopic scale, combined with increasingly powerful computational approaches, can help us begin to unravel the mysteries surrounding the most basic concepts of friction.
REFERENCES
1.
Tysoe, W.T. and Spencer, N.D. (2016), “Looking at lube in a new light,” TLT,
72 (4), p. 72.
2.
Weber, B., Suhina, T., Junge, T., Pastewka, L., Brouwer, A.M. and Bonn, D. (2018), “Molecular Probes Reveal Deviations from Amontons’ Law in Multi-Asperity Frictional Contacts,”
Nature Comm.,
9. Doi: 10.1038/s41467-018-02981-y.
3.
Suhina, T., Weber, B., Carpentier, C.E., Lorincz, K, Schall, P, Bonn, D. and Brouwer, A.M. (2015), “Fluorescence Microscopy Visualization of Contacts Between Objects,”
Angew. Chem. Int. Ed.,
54, pp. 3688-3691.
Eddy Tysoe is a distinguished professor of physical chemistry at the University of Wisconsin-Milwaukee. You can reach him at wtt@uwm.edu.
Nic Spencer is professor of surface science and technology at the ETH Zurich, Switzerland, and editor-in-chief of STLE-affiliated Tribology Letters journal. You can reach him at nspencer@ethz.ch.