Determining and solving varnish problems
Debbie Sniderman, Contributing Editor | TLT Webinars November 2015
Characterization and classification helps determine better mitigation.
KEY CONCEPTS
• Varnish is anything that comes out of a lubricant that can cause operational issues. It can be present in many forms.
• One way to classify a varnish is by the four chemical types: organic, non-organic, lubricant and water.
• Using the Root Cause Analysis helps to understand what happens in a process and is key to controlling degradation.
MEET THE PRESENTER
This article is based on a Webinar originally presented by STLE University on Dec. 3, 2014. “Determining & Solving Varnish Problems” is available at
www.stle.org: $39 to STLE members, $59 for all others.
Dr. David Wooton is an independent consultant for the lubricants industry, known on a worldwide basis as an expert in the field. He has more than 30 years of experience as an analytical chemist, with much of that time specializing in fuels and lubricant analyses and research. He is best known for his expertise in Fourier transform infrared spectroscopy (FTIR) analyses of in-service fluids. He is currently the co-chairman of ASTM D02.96.3 Committee on in-service FTIR. In 2001 Wooton founded his own company, Wooton-Consulting, as an industry consultant.
In recent years he has focused on the problems of varnish and is aiding the understanding of this problem. He has been thrust into being one of the top world experts in the area. Wooton has lectured worldwide and has more than 60 publications and 15 patents in the chemistry and lubricants field. You can reach Wooton at
davewooton@wooton-consulting.com.
 David Wooton
WHAT IS VARNISH?
In general a varnish is anything that comes out of—or not in a homogenous single phase with—a lubricant that can potentially cause operational issues. The deposits that exist in most lubricating systems are called varnishes, and they are one of the most important reliability issues in rotating equipment and servo actuators in hydraulic equipment.
Varnish can be present in many forms (
see Figure 1). When it is soft and gooey, it’s sometimes known as sludge. When varnish is hard and brittle, it is known as lacquer. Varnish can form “stalactites” on ceilings of reservoirs or other surfaces in a system, and varnish deposits come in a wide range of colors.
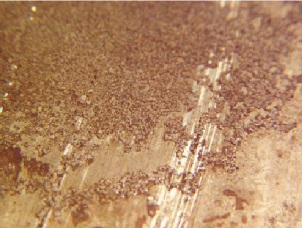 Figure 1. A solid form of varnish that has bound to the working surface.
Varnish deposits cause a host of serious problems. “Sticking valves, plugged lubricant orifices or filters, inefficient heat exchanger operation, poor bearing lubrication and loss of seals are some of the most well-known issues,” says David Wooton, owner of Wooton Consulting, in a Webinar originally presented by STLE University Dec. 3, 2014.
A wide array of chemical materials make up varnish, leading to great variation in appearance. Since all varnish does not come from one root cause, it cannot be mitigated by one technique. It’s important to understand a deposit’s chemistry in order to understand its root cause and where it comes from before removing it from the system and stopping it from forming.
Wooton views solving varnish problems as “the chemist’s approach to helping the mechanic correct his problem.” He thinks joint projects are needed along with a systematic approach in order to understand what is happening before jumping in to suggest corrections.
ANALYZING DEPOSITS
When there is a problem, first analyze the varnish by looking at it. Take a sample of the varnish and determine its physical appearance (
see Figure 2). Is it gooey, sticky, a powder, burnt, chunky or maybe a jelly?
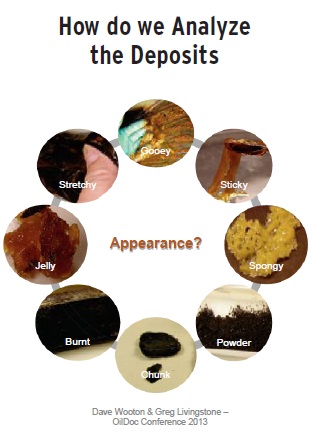 Figure 2. The many physical forms varnish can take.
Then notice its color, which can reveal a lot about the varnish (
see Figure 3). There are serious differences between a very dark brown-colored varnish and a black varnish. Black is often a soot or coking material, but brown is not. Other fluids produce varnishes with different colors, each causing operational problems and having an associated cause.
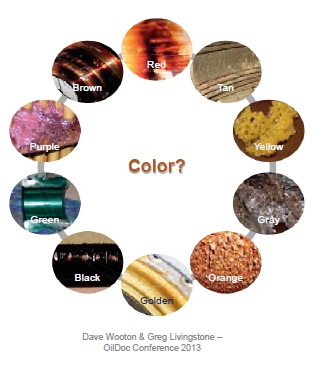 Figure 3. It is important to visually assess the color of varnish.
Varnish samples can have multiple colors that vary radically such as one sample that is yellow at the outside then turns red and finally brown in the center. Color differences indicate the varnish is not all the same chemistry, and the presence of more than one color can say something about how the deposit was formed.
In one phosphate ester system, Wooton saw jelly-like varnishes in separate locations, one purple and the other yellow. The purple one turned out to have metals in them indicative of corrosion and wear problems, and the yellow had no metal. Knowing the chemistries and how the varnish is formed can help determine how to mitigate and eliminate the cause of the problem.
“The current practice is to assume that all varnishes are created equal, but this is far from correct,” says Wooton. “Varnishes can’t be the same if their appearances and physical properties aren’t the same. Even with a brown varnish, it is not correct to assume that it must be the same as the last brown varnish that was seen. Rather than use assumptions, use analytical tools to categorize and gain understanding about what it is.”
Another common assumption is that all varnishes come from oxidation sources, but Wooton says this is naïve: “Varnish is not only due to oxidation or degradation products. Yes, oxidation is a common mode of fluid degradation, but there are many modes of degradation and sources. Varnishes can come from any foreign material that causes a deposit in or comes out of a lubricant. Again, assumptions lead to incorrect decisions and incorrect corrective actions. (
see Figure 4).”
 Figure 4. Allow the results of a Root Cause Analysis to direct the progress.
In order to understand varnish problems, it is important to look at both components of the system separately—the lubricants and the deposits. Perform organic and elemental analysis on both the deposit and the lubricant to understand the non-organic and organic components in each. Often the two are mixed, and it is difficult for a deposit to form without lubricant mixed in it. But it is important to understand the lubricant is in the deposit, not just the deposit itself.
After knowing the chemical makeup and characteristics of both, compare the difference between the two. Sometimes the lubricant is one material and the deposit is something else, which could indicate that maybe the lubricant wasn’t the new lube it was supposed to be, or maybe something has changed or contamination has occurred.
A very common source of varnish is incompatibility between fluids. Mixing incompatible fluids forms sediments in a system that can cause the same type of problems that may be seen when oxidation occurs. Organic and elemental analysis data allows the type of deposit to be classified, so sources of what is causing the problem can be determined. Allow the results of the analysis to direct the progress toward fixing and preventing the problem.
CLASSIFY BY CHEMICAL TYPE
In his role as a consultant, Wooton has seen at least 85 different chemistries all defined as varnishes over the years. Because there are a high number of lubricant chemistries, and they degrade by many mechanisms, the number of deposit chemistries is virtually limitless. He developed a classification scheme that groups the deposits by physical characteristics and source of formation. The classification bins make it easier to understand the sources of the deposits and determine appropriate remediation efforts.
The first way to classify a varnish is by the four chemical types: organic, non-organic, lubricant and water. Non-organic deposits are insoluble in highly polar organic solvents and contain no carbon-hydrogen spectral features. They come from various separation points from reaction and non-reaction points of chemistries. They contain substances like zinc sulfate, which commonly comes from the decomposition of antiwear products in hydraulic oil.
Organic deposits are materials that contain carbon-hydrogen bonds (CH
2 and CH
3). They are insoluble in hydrocarbon solvents like base oils or new oils. Most are soluble in polar organic solvents like ethanol, methanol, acetone and methylene chloride. Often called “soft contaminants” because most organic materials are soft, these deposits may not always be soft when they are present on moving parts like bearings.
Lubricant deposits come from the lubricant oil itself. They may come from untouched, brand new lubrication. Finally, Wooton says that water can’t be ignored because it is often present. Even simple inorganics undergo hydration and soft, sludgy varnishes can contain up to 80% water. Water must be considered as part of the varnish.
CLASSIFY DEPOSITS BY SOURCE
After observing the visual and physical appearance of a varnish and its chemical type, careful classification is done by understanding its source. Wooton describes six sources of organic deposits and four sources of non-organic deposits. Organic deposits can be:
1. Formulation derived. These occur in additive components that have reacted and drop out of solution, sometimes in an unreacted state. Oils that were poorly blended or cross-contaminated can produce these types of deposits.
2. Thermoplastic. High-temperature degradation processes produce high molecular weight organic molecules that act like thermoplastics. They are typically solid and can crack off like glass at room temperature and liquid and flow at elevated temperatures.
3. A product of thermal decomposition. Long hydrocarbon molecules tend to crack at temperatures above 300 C, forming inorganic coke, small molecules that volatize from the fluid and larger molecules that condense and grow back together again. These high-temperature conditions—when fluids are heated too hot in some zones—will form coke on the surface but also forms up to 6-10 different pre-coke components in the liquid that came from the original organic fluid. Some have different colors and slowly degrade to a hot black solid as coke is formed, depositing elsewhere around the fluid, not necessarily where the hot spot was. Pre-coke products are still organic but haven’t fully developed into inorganic coke; although they are heading that way.
4. Oxidatively derived. This is the most common classification found in lubricant deposits because oxidation is one of the primary lubricant failure modes.
5. Contaminant derived. Organic contaminant ingress is very common, often from incompatible fluids or other contaminations that come out of solution. Gas ingress such as CO
2 is included in this category, which is a terrible problem when formed in compressor systems. The CO
2 can be by itself or when combined with other products.
6. Biologically derived. Deposits that are derived from biological ingress include plant materials, microbial growth, sugar, cotton and proteins. Microbugs and other contaminants can be seen in steam systems and deposits often form at water/oil interfaces. These are organic and when they enter solution or the fluid, clog filters rapidly. It is possible to see severe cases and this category can’t be ignored.
Non-organic deposits can be a result of inorganics, both metallic and non-metallic, soot, coke or coal. Rust, a metallic inorganic source of deposits, is a product of a problem involving water ingress, so water also may be seen at the same time. Rust can migrate from other areas or sections. Other inorganics such as metal salts also are possible. In coal pulverizing machines that throw coal dust around in the air, coal ingress can be seen in oil if the top of its tank hasn’t been sealed properly allowing it to collect in the liquid.
UNDERSTAND DEGRADATION MECHANISMS
Understanding what happens in a process is key to controlling degradation. Wooton presented a scenario to illustrate good application of the Root Cause Analysis (
refer to Figure 4) in action. A gas turbine power plant had a problem—its fuel control stop valve’s last chance filter was binding off. Particle counts in the fluid were good, implying there was no problem, but the filter was still getting plugged. What to do?
First, the filter was pulled out of the system, the oil was drained, and it was examined visually. Inspections revealed that fuzzy media completely clogged the filter. The media crumbled and peeled off the filter’s wire mesh easily. Next, the filter was submitted for deposit characterization and analysis; upon closer inspection, the fuzzy media was found to have a crystalline structure.
The oil was washed off with petroleum ether, and fibers were extracted using tweezers and methylene chloride solvent. It turned out that the fuzzy deposits were 100% soluble in methylene chloride, meaning it had to be an organic material that formed or ingressed in the system upstream and collected in the filter.
Fourier transform infrared spectroscopy (FTIR) analysis showed that the media was primarily composed of carboxylic acids and other chemistries including phenols, esters and quinine, which are oil degradation products. These degradation products had crystallized out in this section of the system because of lower temperatures. Deposits were likely to be in other parts of the system as well, and would interrupt operation if not addressed. In this scenario, the recommendations were to do more oil analysis to determine the condition of the oil, consider heat tracing the hydraulic lines running to the servo valve to prevent future deposit formations and find ways to remove the product. The mitigation techniques directly address the kinds of chemistries seen (
see Figure 5).
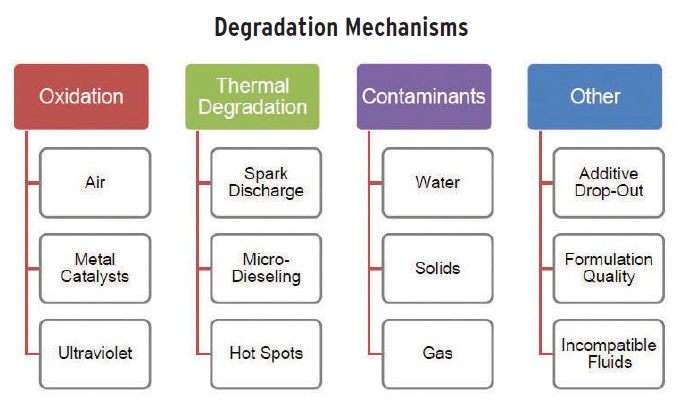 Figure 5. Types of fluid degradation and their causes.
SPARK DISCHARGE
Figure 5. Types of fluid degradation and their causes.
SPARK DISCHARGE
There are many other fluid degradation mechanisms. Spark is one type of thermal degradation in oil that is a serious issue. It’s caused by a buildup of static charge that can occur when fluids rub or move through narrow spaces. The snapping noises that can be heard inside filters is a sign that spark is happening. The hot corona of an arc produces a hard thermoplastic that can break when hit by a hammer and fills the entire filter (
see Figure 6). When spark occurs, it happens throughout a filter.
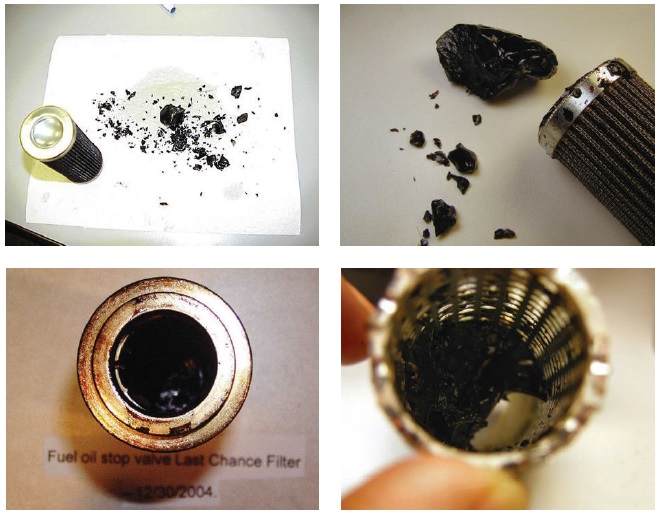 Figure 6. The hard carbonaceous deposits in filters can be broken with a hammer.
ULTRAVIOLET CAUSES OXIDATION
Figure 6. The hard carbonaceous deposits in filters can be broken with a hammer.
ULTRAVIOLET CAUSES OXIDATION
In another case ultraviolet light from common sunlight can be a source of fluid oxidation. Wooton describes an experiment that stored two samples of the same fluid in the same location for a month, one with a towel covering it and one that was exposed to sunlight. There was a clear difference after one month. The sample exposed to light was dark brown, having undergone serious degradation, and the protected sample was not. Never store fluids in the sunshine, he advises. When pulling lubricant samples for tests, store them in a closed box; don’t leave them out where they can decompose. Even after only four hours, results will not be repeatable or representative of the actual process if they are set in light.
AVOID WATER—IT’S A CONTAMINANT
It is underestimated what water is as a contaminant. Getting rid of water can dramatically extend a fluid’s life in a system. In some cases, as much 40% of a fluid’s life can be accounted for by an increase in the amount of water present.
In one water ingress study, Wooton observed ISO 68 hydraulic oil in two different operating conditions, one at high water content of 1,000 ppm and one at low <50 ppm. The oils were analyzed after 1,500 and 2,000 hours of operation. The high water content sample showed most of the primary zinc dialkyldithiophosphate was depleted, and there were copper (Cu), thermal and hydrolysis products associated with Cu after 1,500 hours. At 2,000 hours, all of the primary and secondary antiwear was depleted, and many products of decomposition were seen including 108 ppm of Cu. The product was clearly starting to fail.
In the exact same preparation with low water content, at 2,000 hours both primary and secondary antiwear had only minor decomposition; there was <1 ppm of Cu, and no hydrolysis products were observed. Clearly water in hydraulic systems interfered seriously and is very detrimental.
The link between acid and water was seen in a different study of sludge in an older steam turbine. At the bottom of a centrifuge, oil is spun at an elevated temperature in the presence of water. Many possible reactions can occur between oil and water there, promoting varnish formation in that region. The dark brown looking semi-solid varnish that collected there was analyzed and contained no esters but high amounts of acid.
If there are acids and a large water content, that is a sign that there’s a water-induced oxidation problem. The water helps promote the fluid to oxidize, destroying the fluid. In the absence of water at <50 ppm, there was no acid, oxidation or sludge. Wooton says these sludges that can migrate out of centrifuges are the same exact ones that can migrate to pipes and at the bottom and sides of sumps.
INCOMPATIBILITY—A GROWING PROBLEM
In his role as a consultant, Wooton hears things like, “We mixed these fluids and now we have mud,” and, “We flushed almost all of the old fluid out of the valve but left some behind.” The biggest mistake in these cases was not making certain that old and new formulations were compatible.
Oils frequently change formulations, and new base stocks and additive components are used regularly. Most Group V base stocks are not compatible with mineral oils. Old foam inhibitors may not be compatible with new foam inhibitors and rust inhibitors may be incompatible. Vapor space inhibitors in new turbine components are not always compatible with turbine oils.
Two new oils may be compatible but may become incompatible if one of the oils is mixed. Unstirred, two compatible oils remain separate in different layers with differing colors. Stirred, they combine to form a single mixture of a different color (
see Figure 7).
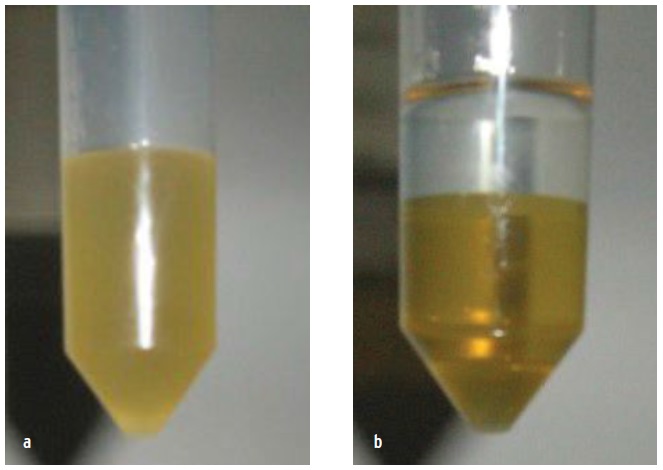 Figure 7. Two new oils—(a) stirred and (b) unstirred—may be compatible and become incompatible when mixed.
A common way to test for compatibility is to blend the two, then run foam, demulsibility and membrane patch testing studies. The foam test looks at the air/liquid interface. The demulsibility test looks at the liquid/liquid interface. The membrane patch looks at solid/liquid interface. And Wooton advises a visual inspection; look at the sample itself to see if it’s clearly bad.
“When varnishes form, something in the fluid affected these interfaces. The interface is the first thing that goes bad when things are incompatible. Once a foam occurs, varnish coming out of solution is not far behind,” he says.
It is critical to test. Do not assume compatibility. Have your oil supplier perform compatibility testing according to ASTM D7155, the Standard Practice for Evaluating Compatibility of Mixtures of Turbine Lubricating Oils.
ANY ANALYSIS HELPS
Oil analysis is a powerful tool to solve fluid degradation problems. “Varnish is out there, and it needs to be studied,” says Wooton. “Sample it. Don’t make assumptions. Do the proper characterization and classify the deposits by chemistry and source. Put the two together and develop a mitigation plan to eliminate the root cause of the problem. This produces clean and reliable systems, providing significant cost savings to the bottom line, which is what we want to go after.
“Many people ask how to get started analyzing varnish problems, what to do, and what to sample. Take the first major step toward a deposit-free system. Find the contamination and take the whole part off. Performing any analysis tells something. A little knowledge goes a long way,” says Wooton.
Debbie Sniderman is an engineer and CEO of VI Ventures, LLC, an engineering consulting company. You can reach her at info@vivllc.com.