Leveraging the power of oil analysis
Jeanna Van Rensselar, Contributing Editor | TLT Feature Article January 2014
‘It’s the little details that are vital. Little things make big things happen.’
—John Wooden
KEY CONCEPTS
•
Selecting the right mix of equipment and tests is the first and most critical step in a successful oil analysis program.
•
Failure to follow through on details, such as reading the entire report or poor sampling methods, is the primary cause of poor ROI.
•
A good relationship and solid communication with the testing lab is essential.
AND SO IT IS WITH OIL ANALYSIS where the time and attention to detail makes the difference between mediocre return on investment and spectacular return that saves critical equipment, prolongs the life of expensive machinery and eliminates the surprises that lead to shutdowns.
On the surface, the whole process seems straightforward: select the equipment, take the sample, send it to the lab and wait for results. In the real world:
•
Equipment selection is random and based on what one person thinks should be tested.
•
Samples are taken from the locations with the easiest access and not from where they best represent the oil in use.
•
Samples sit around for several days before anyone sends them to the lab.
•
The lab doesn’t process the sample in a timely fashion.
•
The lab report is formatted in a way that assumes customers have a background in statistics.
•
The lab report doesn’t really matter anyway because either no one reads it thoroughly or it doesn’t get read at all.
•
No one follows through on obvious action items.
David Kirkwood, business development manager for TestOil in Strongsville, Ohio, explains, “Many organizations throughout the world have implemented oil analysis programs to help manage equipment reliability. Some have experienced substantial savings, cost reductions and increased productivity. A successful oil analysis program requires a dedicated commitment to understanding the equipment, the lubricant, the operating environment and the relationship between the test results and actions to be performed.”
Paying attention to detail means doing everything just a little better at every stage of the oil analysis process.
BETTER EQUIPMENT SELECTION
Smart, strategic equipment selection is one of those details where customers should take advantage of their lab’s expertise. STLE-member Alessandro Paccagnini, CLS/MLTI, laboratory manager at Mecoil Diagnosi Meccaniche Srl, Firenze (Florence), Italy, says, “When we help customers choose the equipment to be monitored using oil analysis, the first criterion is always equipment criticality within the production process. How costly would an unscheduled equipment failure be? The second criterion is equipment repair cost. Then it comes to operating conditions severity and actual equipment fault history, for example using FMECA. (
1)”
Equipment critical to plant operations is generally the most important (especially if there is no backup to replace it), followed closely by the most expensive equipment. The Criticality Index ranks equipment based on how important it is to operations. It places each piece of equipment into one of three categories:
•
Critical: The rest of the working environment can’t function without it and there is no backup.
•
Essential: This equipment is key but not critical to the operating environment—usually the case if a backup exists.
•
General purpose: This encompasses everything else.
BETTER TEST SELECTION
Nearly all fluid analysis labs are experts at recommending tests to their customers. The problem is that some customers don’t trust their labs—thinking that labs are recommending expensive tests they really don’t need. So they schedule tests without consulting with their analysis provider. Customers can be assured that they are selecting the right tests and the right frequency by insisting that their labs take the time to explain
why they recommend specific tests.
Basic oil analysis tests fall into one of three categories:
1.
Lubricant condition—whether or not it is ready for a change.
2.
Contaminants—whether there are machine-degrading contaminants present and, if so, what and to what extent.
3.
Machine wear—in the form of particles that indicate the level and rate of machine deterioration. Following are four specific tests that are performed on most samples in most labs.
Viscosity. Viscosity is a measure of a fluid’s resistance to flow (thickness), which is affected by a number of factors, including temperature (which is why the report states the viscosity at a specific temperature). Viscosity is measured at standard temperatures of 40 C and 100 C because industrial oils are graded according to their viscosity in centistokes at 40 C, while mobile (mostly multigrade) oils are graded according to their viscosity in centistokes at 100 C. The viscosity index (VI) measures how much viscosity changes with temperature.
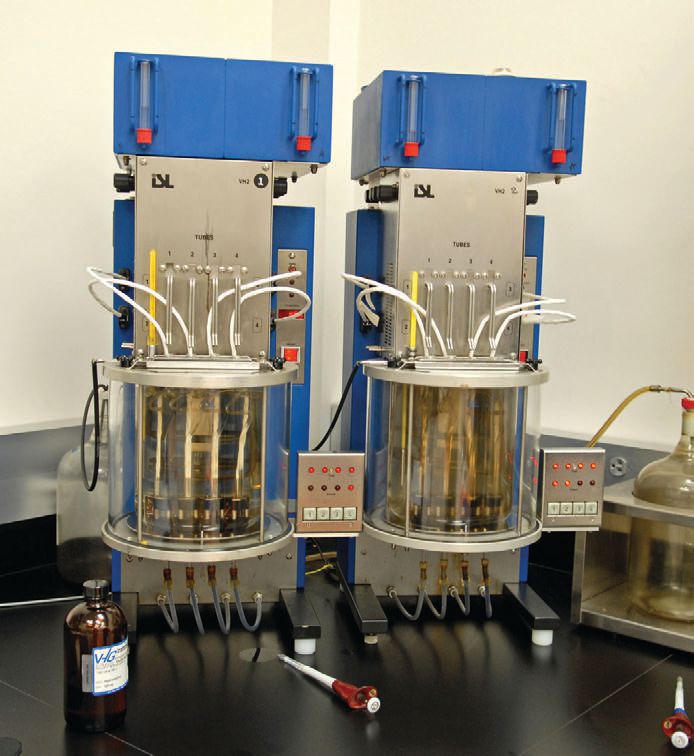 To measure viscosity, a predetermined volume of lubricant is introduced into the viscometer tube. Gravity causes the sample to flow through the tube. The amount of time the sample takes to flow through the calibrated portion of the tube is recorded. The time is multiplied by the tube’s calibration factor to give the result.
Water (rust, oxidation).
To measure viscosity, a predetermined volume of lubricant is introduced into the viscometer tube. Gravity causes the sample to flow through the tube. The amount of time the sample takes to flow through the calibrated portion of the tube is recorded. The time is multiplied by the tube’s calibration factor to give the result.
Water (rust, oxidation). Water is one of the more common (and preventable) contaminants, but its potentially devastating effects include rust, increased wear rate, the formation of acids from chemical reactions between additives and base oils, biological formations (i.e., mold and algae) and loss of additive functionality and the additives themselves.
Particle count. Particle count measures the size of the particles and the content relative to the entire sample. The test quantifies all solid particulate within a sample that is 4 microns and larger. Most normal wear particles are too small to be counted by this method.
Spectroscopy. Spectroscopy measures the concentration of a variety of elements in the oil. These elements include wear metals, contaminants and oil additives.
Some elements fall into multiple categories. In order to pinpoint the source of the elements, all of the results need to be reviewed. It is generally limited to measuring particles in the 0-5 micron range (at most 8-12 microns).
Beyond this, test selection and test frequency need to be strategized with the lab—taking into account such factors as results that need further investigation, criticality, age, operating conditions, function and protocol specific to that type of machinery.
In the case of TestOil, anytime from the initial analysis that a machine condition is flagged as abnormal, an analytical ferrography is automatically performed. Kirkwood explains, “We feel that it is impossible to determine what is occurring inside the equipment and impeding its health without visually inspecting the wear particles present in an oil sample. Measurements, compounds, color microscopic photos and summaries from the analyst are provided as a part of this additional test.”
CONSIDERATIONS FOR CHOOSING A LAB
Following are a few considerations for selecting an oil analysis lab:
•
What are the costs per test and what is/is not included?
•
How easy is it to read and interpret reports? (Ask to see a sample report.)
•
What guarantees does the lab offer?
•
What are the lab’s hours of operation?
•
How much technical support is available?
•
How quickly can the sample get to the lab?
•
What are report delivery and format options? Can users sort data?
•
What is the turnaround time for sample results?
•
What kind of customer training programs does the lab offer?
•
Does the lab have proper ISO accreditation?
•
Do tests conform to ASTM standards?
•
Are lab employees’ skills kept up to date and/or are they regularly certified?
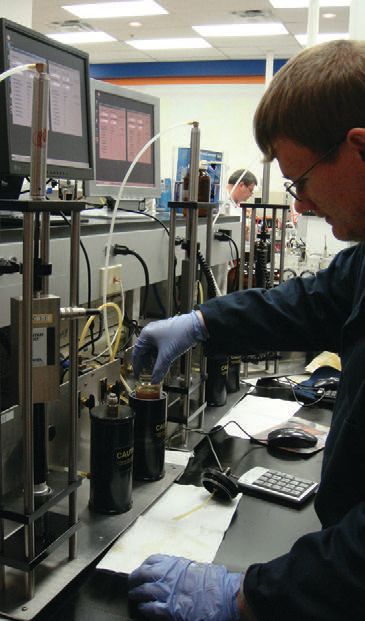 One of TestOil’s lab technicians demonstrates the particle count test, which measures the amount of particulates in a fluid sample. Using the pore blockage method, the sample is passed through a calibrated screen. As particles collect on the screen, the amount of flow decreases. This decrease in flow is measured and the particle count result is obtained.
BETTER SAMPLING PROCEDURES
One of TestOil’s lab technicians demonstrates the particle count test, which measures the amount of particulates in a fluid sample. Using the pore blockage method, the sample is passed through a calibrated screen. As particles collect on the screen, the amount of flow decreases. This decrease in flow is measured and the particle count result is obtained.
BETTER SAMPLING PROCEDURES
Better sampling procedures are the result of better training, and many analysis labs offer training to customers either for an additional fee or as a value-added service. If a customer has enough participants to fill a class, some analysis providers will teach lubrication fundaments and practices onsite. Other excellent sources of training are seminars, tradeshows and conferences.
Ultimately, establishing sampling protocol is the customer’s responsibility, but the lab can help by identifying logical equipment, specific tests and their frequency. In addition, the lab will provide the best procedures for taking and then accurately and completely labeling the sample. Label information should include anything out of the ordinary (such as topping off with a dissimilar fluid) that has occurred since the last sample.
Experts say that not choosing the right equipment and not sampling correctly are the two most common causes of fluid analysis program failure. Most samples are taken at a drain port, but since drain ports (and the drop-tube and vacuum pump method) are prone to producing contaminated samples, this location is not ideal. A better option is a dedicated simple-to-install sample valve that’s free of contamination sources.
“The most common errors people make when collecting a sample are related to poor sample location, faulty collection methods and sample contamination,” Kirkwood says. “A sampling location should be identified to allow for trouble- free, repetitive and representative sampling of the health of the equipment and the health of the lubricant. This location should allow the equipment to be tested under its typical operating condition while maintaining a safe sampling method for the technician.
“Lastly, it is important to ensure that the sample does not become contaminated during the sampling process,” Kirkwood adds. “All of the sophisticated oil analysis tools, techniques and diagnostic processes are meaningless if the oil sample fails to effectively represent the actual condition of the oil in service.”
The customer should send samples to the lab the same day they are collected. In fact, it’s best to overnight or handdeliver samples. Waiting longer affects the integrity of the sample and prevents prompt action on critical issues that the lab uncovers. Even labs that don’t offer online access to reports should have the results to customers no more than 48 hours after they receive the samples.
“The two most common errors are picking a sample point that is not representative of the system, for example from bottom drain of reservoir, and not adequately flushing the sample point to pull
live oil,” says STLE-member Evan Zabawski, CLS, senior reliability specialist at Fluid Life in Calgary, Alberta, Canada. “Improper sample location and/or flushing will skew the results to generally show higher wear and contamination. For example, sampling from drain tends to pull much of what has normally settled out of the oil that is not usually causing problems.”
Zabawski further states some general rules of thumb for sample point selection:
1.
For systems with lubricant piping: on or after an elbow to ensure turbulent flow homogenizes the fluid.
2.
On return lines or after the return line header to assess the wear of the components.
3.
When return lines are not available: after the pump and before the filter.
4.
For filtered systems: on the inlet side of the filter represents a live area with turbulent flow.
5.
For systems without piping, pump or filtration (e.g., gearboxes) that must be sampled through a drain port: use a sample port equipped with a pitot tube (bent if necessary) to reach a live area.
INTEGRATING WITH OTHER CONDITION MONITORING TECHNIQUES
For critical and expensive machinery, it makes sense to supplement oil analysis with the following complementary condition monitoring technologies:
•
Vibration Analysis. Oil analysis and vibration analysis complement each other well; vibration analysis monitors and controls balance, looseness and alignment, while oil analysis monitors and controls lubricant quality and contamination.
•
Thermography. This detects issues that oil analysis can’t such as the degree of deposit buildup in tanks and the condition of couplings, rollers and high-speed bearings.
•
Ultrasound. This complements vibration analysis well. Trending values will point to potential bearing defects caused by contact conditions such as rubbing and friction.
Newer test technologies include embedded sensors, motor current analysis and stress wave analysis.
“Vibration analysis, thermography, ultrasonics are all great additional tools, but we must not forget our five senses,” says Evan Zabawski, CLS, senior reliability specialist at Fluid Life. “People who are familiar with an asset can tell if it feels too hot or is making more noise than usual, etc., and that can be an earlier indicator. When pulling a sample, noticing cloudiness, foam or separation reveals immediate information that doesn’t need to wait for lab results to understand there is a problem.”
BETTER REPORTS
Kirkwood explains, “A common issue that end-users have with reports is understanding and interpreting the reports they receive from their labs. Some reports are just difficult to read and interpreting the data becomes guesswork. Also, oftentimes the tests run are not appropriate for the oil in the equipment or aren’t adequate to allow a complete assessment of the lube or machine.”
Most labs make reports as easy to read as possible—but someone still needs to read them. Today, nearly all labs provide digital reports that are instantly available online. In addition, many labs now offer proprietary Web-based tools that let customers easily interpret and customize the information contained in their oil analysis reports. In addition to information on the oil’s condition, digital reports allow users to review and compare past reports (trend analysis, the key to predictive maintenance) and create easy to interpret trend graphics.
STLE-member Eric Arnold, CLS/OMA/MLT II/MLA III, a field engineer at Castrol Heavy Duty Lubricants, explains, “The predictive component of condition monitoring is the ultimate goal. Individual oil samples give a snapshot of the condition at a given point in time. Trend analysis of consecutive samples of the same component over time gives indications of what’s to come. On a larger scale, comparison of multiple ‘similar’ components also can highlight trends of commonalities between units, which can be of greater value to a predictive program.”
“Our reports are neat, clean and easy to read,” Kirkwood says. “We also have the capability to display any corrective actions taken by the customer from previous samples. Looking at our report gives the customer a very clear and concise history of the problems and actions taken on that machine.”
Arnold says, “Computer software has been the largest contributor here—the ability to analyze and distribute large amounts of data easily and quickly. There is also improved accuracy of oil sample input data like the use of oil sample labels generated online.” In addition to Castrol’s proprietary Labcheck software, Arnold says that other game-changers include mobile devices, more powerful computers and more capable data analysis software.
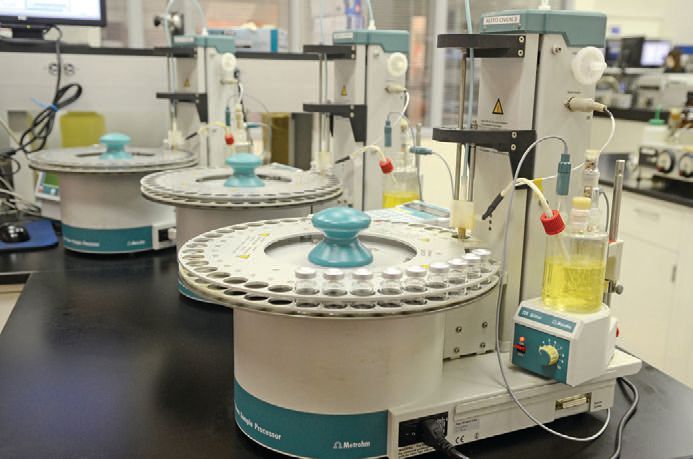 The Karl Fischer test measures the amount of water contained in a sample. A portion of the sample is measured and introduced into the Karl Fischer titrator. Any water present in the sample will react with the Karl Fischer reagents. The amount of reagent needed to react with the water present is measured and used to calculate the amount of water present. Results are given in parts per million (ppm) or percent.
Zabawski says that trending based on comparison to other similar assets and previous samples is very powerful. ASTM D7669 and D7720 both offer useful guidelines for performing such analysis (
2). Fluid Life reports employ intuitive color-coded reporting of the data to highlight anomalies, coupled with dynamic inclusion of graphs using proprietary statistical comparison to other samples from similar make, model, oil and industry matches and statistical trending to identify both upward and downward deviations from historical results.
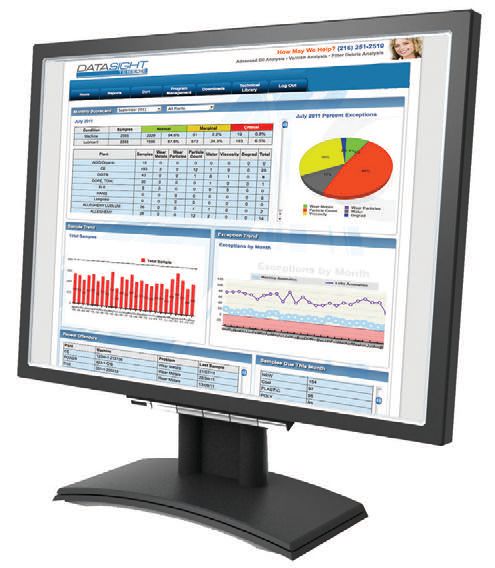 TestOil’s DataSight® program management tool is a proprietary Web-based data-reporting application. As with similar Web-based reporting systems, it allows TestOil’s customers to track all aspects of their oil analysis program online.
CUTTING-EDGE REPORT METHODOLOGIES
TestOil’s DataSight® program management tool is a proprietary Web-based data-reporting application. As with similar Web-based reporting systems, it allows TestOil’s customers to track all aspects of their oil analysis program online.
CUTTING-EDGE REPORT METHODOLOGIES
Most oil analysis providers have developed reporting methods that take advantage of the latest Web-based tools. Two of these providers are TestOil and Castrol.
TestOil developed DataSight,® a Web-based data-reporting application that allows its customers to track all aspects of their oil analysis program. Using DataSight, customers can analyze data and plot trend graphs, generate monthly management reports and more. TestOil also has devised a unique email-based notification system that communicates with customers as their samples flow through the lab. Customers are notified when the samples are received and again when the testing is completed. There are direct links built into the email that take the user directly into their DataSight account where they can begin analyzing the results and taking action.
Each TestOil report includes a color-coded assessment of both lubricant and machine condition prominently displayed in the top corner of the report and an area highlighting and clearly defining the specific anomalies the analysts found with the sample, along with recommendations and suggestions of potential actions to take. Each TestOil report also includes five columns of data representing the information it obtains from running a reference oil and a column showing the most current findings followed by data from the customer’s last three samples. In addition, TestOil provides trend graphs on five of the most critical parameters.
The company also includes a second page of analytical ferrography analysis whenever there is a machine anomaly.
Castrol’s
Labcheck is a used oil analysis program that provides ongoing analysis of used oil samples and a full range of information that supports operations and maintenance decisions.
All information in the report is available for tracking and monitoring performance. Following the fourth routine sample, results are trended and available graphically for easier reference; trending specific parameters provides a better overview of system and/ or machine performance. Technical recommendations are given whenever analysis results are outside the agreed limits. Customers have their choice of reporting methods–from traffic light warnings to straightforward data only and also their choice of download formats. Reports can be retrieved online as soon as the analysis is complete, and all reports (current and historical) are stored in a single, easily accessible location.
BETTER REPORT REVIEW
Most oil analysis reports have the same basic information. That information is usually qualified by observations, flags of problem areas and a summary. Oil analysts advise customers to read the entire report, rather than just the summary and flagged areas. There is always the possibility that the lab may have missed an outlier or sent a report by mistake that was created for another customer.
Also, some customers don’t read reports promptly (or at all). This becomes obvious after a critical piece of equipment breaks down and management discovers the report predicting the failure was never read.
“End-users typically do not understand what the numbers represent, nor do they necessarily know what levels are normal and acceptable,” Zabawski says, “I liken it to having your blood tested for iron the very first time and the doctor simply telling you it is 125. You would ask 125 what? What’s the usual range, what’s high, what’s low?”
The majority of today’s oil analysis reports are straightforward and easy to read and interpret. In addition, some labs offer formal training in report interpretation. Most labs are available for clarifications and recommendations during normal business hours.
But the responsibility for follow through rests squarely with the customer. STLE-member Michael Mayers, laboratory operations manager for Analysts, Inc. in Stafford, Texas, says, “In today’s plant/shop environment, maintenance professionals are expected to do more with less. This applies to their use of oil analysis. Maintenance professionals have to review and react to oil sample reports, but often they fail to take it to the next step to identify patterns in the data to better predict failures in the future or recognize trends in equipment performance.”
Zabawski adds, “Many customers don’t read every report or all the information on the reports they do read. Their intimate knowledge of the equipment offers them a unique advantage over the laboratory interpretation. It is very much in their best interest to perform a secondary assessment of the data.”
PREDICTIVE AND PREVENTATIVE MAINTENANCE
Predictive and preventive maintenance are not the same. Preventive maintenance is scheduled based on a predetermined protocol, while predictive maintenance is scheduled based on the condition of the equipment trended over time. While the two types of maintenance are different, they have the following three goals in common:
1.
To maintain the equipment in the best operating condition.
2.
To reduce unscheduled downtime as much as possible.
3.
To perform all work on a regular schedule.
BETTER ROI
When companies commit to fluid analysis programs and abandon them in a few months because they aren’t seeing the return on investment, the fault is often their own. “An oil sampling program where a customer is simply taking oil samples and not reviewing or learning from the data is of little value,” Arnold says. “Used oil analysis is a process that when used correctly can yield tremendous results in terms of efficiency, uptime, reduced maintenance expense, etc. Much of this depends on what the customer’s objectives are with the program at the onset. Used oil analysis programs should be measured against these objectives over time to ensure that value is being delivered.”
Arnold adds that the oil analyst’s experience and expertise are crucial for success. “Our greatest asset for providing value is our field engineering team, specifically their understanding of the customers and their equipment/industries combined with their expertise in used oil analysis,” he says.
Following is an excerpt from an oil analysis business case that WearCheck lays out in its report, “Maximizing the Value of Your Oil Analysis Program (
3).”
In a typical oil analysis program, roughly 80 percent of sample results are normal, 15 percent are abnormal, and 5 percent are critical. The largest return on investment from your oil analysis program comes from averting machinery failure in the critical 5 percent of instances. To realize these returns, it is incumbent on the reliability and maintenance departments to ensure that appropriate maintenance activities are carried out based on the oil analysis recommendations. A good oil analysis program demonstrates an obvious return on investment in the following ways: it optimizes drain intervals; it supports service/warranty claims; it minimizes unscheduled downtime; it extends equipment life; it improves equipment reliability; it reduces maintenance costs.
“Ultimately, the success of a program comes down to the dedication and drive of those in charge of running the program and the communication they have with their lab,” Kirkwood says. “A lab has to be much more than a source to get data. They have to be responsive to the customer’s needs and answer questions immediately. They need to give customers the confidence that they are working as a partner to help solve pressing machine issues, that they have someone to talk to who can help interpret a report that they might not understand.”
REFERENCES
1.
Failure Mode, Effects, and Criticality Analysis, performed at either the functional or part level, is used to chart the probability of failure modes against the severity of their consequences.
2.
ASTM Standard D7669 (2011), “Standard Guide for Practical Lubricant Condition Data Trend Analysis,” ASTM International, West Conshohocken, Pa., DOI: 10.1520/D7669-11,
www.astm.org. ASTM Standard D7720 (2011), “Standard Guide for Statistically Evaluating Measure and Alarm Limits when Using Oil Analysis to Monitor Equipment and Oil for Fitness and Contamination,” ASTM International, West Conshohocken, Pa., DOI: 10.1520/D7720-11,
www.astm.org. An example of such a report is attached, see second page for example of the statistical analysis and trending.
3.
Click
here.
 Jeanna Van Rensselar heads her own communications firm, Smart PR Communications, in Naperville, Ill. You can reach her at jean@smartprcommunications.com
.