Complexity in Oil Analysis: Part XII
Jack Poley | TLT On Condition Monitoring September 2013
Timing is everything, but there’s more to sensors and sampling operating together.
LET’S REVISIT, IN PERHAPS A DIFFERENT CONTEXT, a comparison of events I presented numbers of columns ago and pay particular attention to the timing aspect of information, as depicted in the chart (
see Figure 1).
 Figure 1.
There are four examples of a theoretical diesel engine monitoring sequence wherein both static episodic bench testing (offline) and dynamic (online) sensor monitoring are employed. The advent of Tier 1 OA in the first decade of the 21st Century has introduced a time-phase element that heretofore didn’t exist, with respect to in-service lubricant testing and monitoring.
While this is a wonderful development, it also introduces yet another level of complexity, along with added insight, to an evaluator’s job. Only when a sensor detects a problem at relatively nearly the same time a Tier 2/3 (offline/offsite) analysis is being performed, do real-time data synchronize with episodic testing. When the two data types are not in sync, more often the case, there are certain considerations to, well, consider.
Scenario 1: Something occurs that is alertable via sensor, immediately following a “normal” test sample. This is a sensor’s most shining moment, maximum pre-alert.
Scenario 2: The rarer occurrence of near-simultaneous (and corroborating) warnings from both static and dynamic. The primary benefit is the added corroboration and confidence that is provided, justifying specific maintenance decisions.
Scenario 3: A sensor reading provides an alert that is later vetted with bench testing. The level of the sensor alert might determine if a sample needs to be tested further immediately (much easier to opt for if Tier 2 onsite testing is available).
Scenario 4: The sensor is not in the assessment picture because its sensitivity is not sufficient for the problem at hand or sensors installed don’t address that type of trauma.
Stepping back and looking at just the overall OA aspect, and not necessarily the specific suite of tests (yet) or sensors involved (yet), we now have the ability to match up with VIB in real-time, certainly a major gain, and we thus can fill in the blanks to some extent between scheduled sample results. Thermography, an often useful role player for the two primary non-destructive tests (NDT), OA and VIB,* can be put to even better effect, as well, now that OA is Tier 1-capable.
Let’s now take another look at some of the measurements listed from last column’s chart (
see Figure 2).
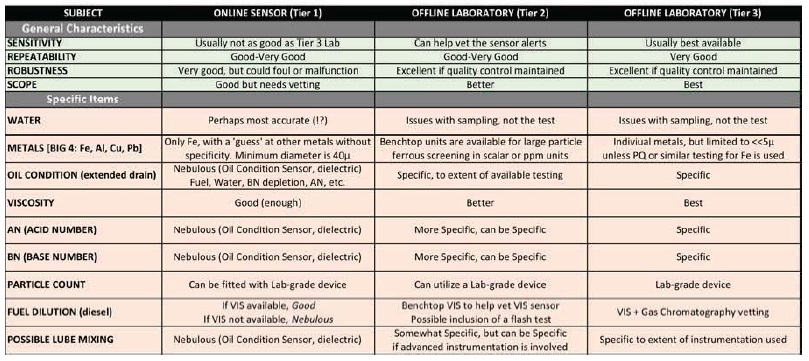 Figure 2. The interplay of online (sensors) and offline oil analysis.
What did you make of these variants?
Water is a sensor’s best territory. The water is measured where the fluid circulates, therefore allowing for saturation and also having the entire sample with which to work. Accordingly the result will be as good as the sensitivity of the sensor as to repeatability (stability in measurement, more correctly). In the lab, where a difficult-to-take representative sample is sampled yet again from its bottle to perform the test, the final value, even if determined via Karl Fischer water, the most sensitive test available for water in lubricants, may be questionable. Assessment:
Score one for sensors, sort of.
Metals detection at earliest opportunity (sensor, real-time) is a great help, for sure, but to my knowledge the most sensitive sensor that sizes ferrous particles with surety is pegged at 40 μ for smallest diameter detectable. It gets worse if nonferrous metals are being measured in the process: detection is somewhere well above 100 μ.
Contrast that with the fact that emission, or absorption, UV spectrometers begin to have blind spots for particles much greater than 2-3 μ and are virtually unable to detect particles greater than 10 μ. This behavioral fact is muddied further, dependent on the element, its chemical form and the test instrument itself. Assessment:
Looks like a draw—big particles go to sensors, timing-wise; small particles go to labs, period. (Wait a minute—don’t small particles come before large in the wear continuum?)
Particle Count (unspecified content)—if desired, one can readily install an online particle counter that is virtually equal to a lab’s instrument; sometimes they might be one and the same. When this is the case, the online instrument has the advantage.
Comparable to the situation with water, the primary advantage is a truly representative sample of the particulates in circulation. After water, a particle count is the most difficult property to be accurately represented in a sample container.
Viscosity—a very interesting proposition, actually. Sensors must make some assumptions regarding conversion of a value that is determined by the operating temperature of the working lubricant. Obviously, variations in temperature over time will make trending difficult at best and somewhat undependable at worst. Unless one has a captive chamber to stabilize the temperature of an oil to prepare it for viscosity measurement at commonly accepted temperatures, this variance cannot be overcome. Sensors must make some assumptions regarding conversion of a value which is determined by the operating temperature of the working lubricant. Obviously, variations in temperature over time will make trending difficult at best and somewhat undependable at worst. Unless one has a captive chamber to stabilize the temperature of an oil to prepare it for viscosity measurement at commonly accepted temperatures, this variance cannot be overcome. Such an instrument is not available to my knowledge.
One could rationalize that for industrial lubes, temperature remains fairly constant in a tight range unless there is something amiss. But many labs will not have considered the many circumstances, particularly with diesel engines, where operating temperature can vary substantially with duty cycle. Yet, too, there is the matter of rationalizing the non-standard temperature to a standard one: 40 C for most industrial fluids and 100 C for reciprocating engines and compressors, as well as a variety of axle lubricants.
While there’s no argument that a Tier 2/3 instrument provides a more accurate VIS, there is something to be said about a VIS value that is clearly abnormal, even with wider variance, if the event occurs in real-time. As important as VIS is within the variety of tests available, it could be too late if a major trauma, such as a fuel leak into a diesel engine crankcase, develops significantly before the next routine sample is to be lab-tested. Assessment: Here the sensor has at least a slight edge, (a.) if the machine tends to run at near-constant lubricant temperature or (b.) if VIS changes at a rapid, significant pace, such as with the diesel engine example following.
Fuel Dilution—while one could set up an FTIR in Tier 2 (onsite) position, that’s probably the closest one could get to providing credible fuel dilution measurements. I’m on record for stating I don’t like the notion of fuel dilution measurement using FTIR. It’s relatively insensitive, at best limited to 5 percent first detection quantity, which is fair-to-poor sensitivity. More important, unless one has constructed reference samples with very similar fuels as are used in the diesel engine under test, there is little confidence to be had with the result. Can it be done? Sure, if there’s a stable source of fuel used over time, wherein the fuel’s properties are repeatable, batch after batch, delivery after delivery. It’s simpler to use GC (gas chromatography), but one is not likely to find a GC onboard, say, a drilling rig, though it could be installed. Assessment:
One could also apply a flash point to Tier 2 level; that leaves direct fuel dilution measurement to the labs at Tier 3 (off-site), more often than not. Tier 2/3 wins here.
Next column we’ll sort this out to some extent for all testing tiers, and some tests and component types, including the notion of wear particle development. As to the latter, perhaps timing is not everything. Perhaps size
also matters.
*Referring to the July 2013 TLT article, this is only valid if the traditional independence of VIB and OA testing and measuring activities are harnessed into an overarching philosophy of CM tool integration. While this is beginning to occur in isolated instances, it is not yet a rooted practice.
 Jack Poley is managing partner of Condition Monitoring International (CMI), Miami, consultants in fluid analysis. You can reach him at jpoley@conditionmonitoringintl.com
.
For more information about CMI, visit www.conditionmonitoringintl.com.