Case study: Central coolant systems
Gary Rodak, CMFS | TLT Technical Analysis August 2013
In this age of communication, organized thoughts are a rare commodity—this is a case in point.
A WELL-RECOGNIZED MANUFACTURER had a rash of warranty repairs that were occurring in a cyclical fashion. They knew exactly which part failed and what features of that part were not machined properly. However, they were not able to determine the root cause of the subspecification machining.
Upper management had even larger problems caused by this component, since a failure in the field typically resulted in the permanent loss of a customer.
The engineers easily identified a specific process and the associated central coolant system.
•
They knew that when the tool costs were high, their component failure rates were high.
•
Compared to similar processes, their cost of manufacturing was not competitive due to high-tool usage and downtime relating to tool changes.
•
Production stoppage for tool changes affected assembly of final components.
•
Scrap rates were high. Most of the time poorly machined parts were not identified until final assembly.
The engineers asked their new chemical manager for the concentration and other data relating to the MWF. The data from the previous chemical managers looked like this (
see Figure 1), but went on for pages covering years of sample collection and lab results.
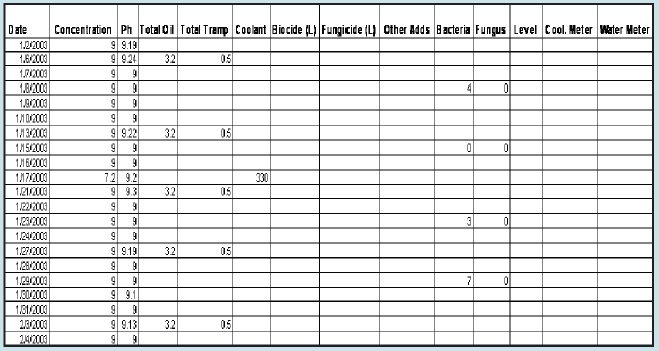 Figure 1.
Unfortunately, it was just a list of dates and numbers. No analysis with trending had ever taken place. When asked to do some analysis, they produced a graph of the data, as shown in Figure 2.
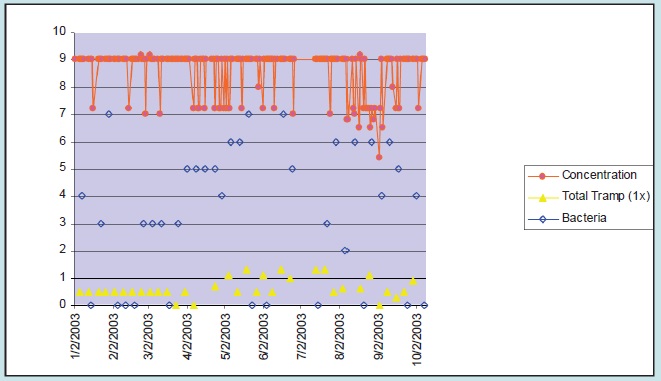 Figure 2. Data as collected and graphed.
The interpretation was that the tramp oil is less than 1.5 percent (low), the concentration is usually 9 percent (high) and bacterial activity varied with no relationship to the tool costs. Tool cost data is kept in a separate database and not readily available (
see Figures 3 and 4).
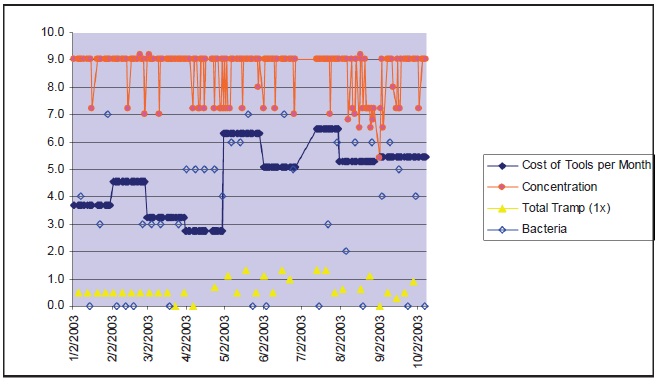 Figure 3. When the cost of tooling was added to the database, the graph looked like this.
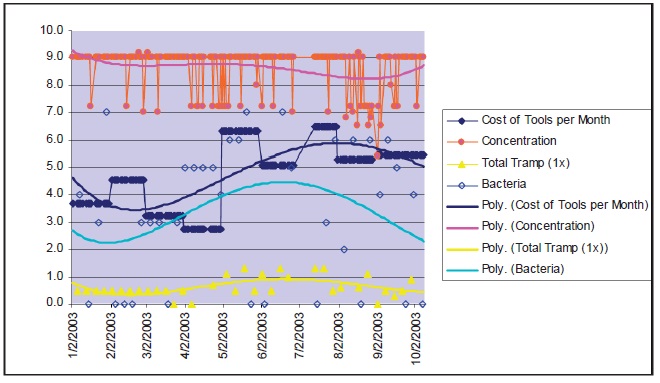 Figure 4. Trending this data demonstrated a relationship between bacteria and tool costs.
When we added arithmetic weight to the coolant data, the direct relationship between tool costs (scrap rates), bacteria and total tramp oil became apparent (
see Figure 5).
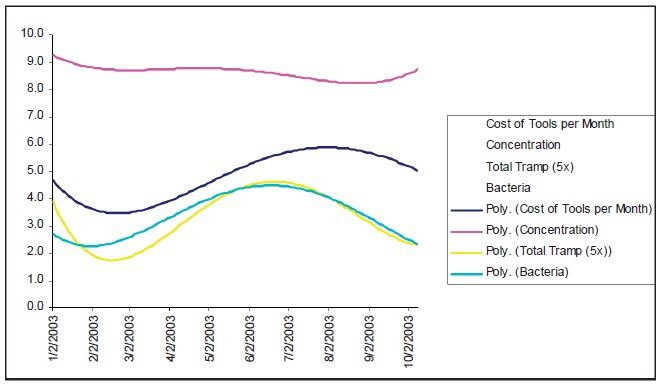 Figure 5. There is a direct relationship between tool costs, tramp oil and bacteria levels.
The points in time when the slope of these trend-lines reverse are the keys to determining the root cause of the warranty problem. The root cause of the problem in this case is the uptime of the tramp oil extraction equipment.
Compounding the difficulty in this data analysis were issues with the historical concentration test methodology, inconsistent sampling techniques and accuracy of the data entry. Those are stories for another time.
 Gary Rodak is the president of Machining Efficiencies, Inc., in Gregory, Mich. Gary has studied machining problems and solutions for over 30 years and served in the metal-cutting industry as a field engineer, technical service department manager, quality manager, product development manager, chemical commodity program manager and a broach tool designer. Gary holds a bachelor’s of science degree in mechanical engineering from the New Jersey Institute of Technology and is an STLE Certified Metalworking Fluid Specialist.™ He is also a Certified Mechanical Engineer through SME. You can reach him at gary.rodak@machiningefficiencies.com
.