Maximizing the impact of lubricant analysis reports
Mike Johnson, Contributing Editor | TLT Best Practices October 2012
Get through to senior managers by choosing a format that emphasizes costs, not technology.
KEY CONCEPTS
•
To move from tabular data to a financial valuation-reporting model, several program design conditions must be fulfilled.
•
With vibration programs, each machine is identified by machine type, make, model, criticality, speed, speed-range and load parameters.
•
Establishing appropriate alarm levels is every bit as important as deciding which tests to schedule.
COMPANIES OFTEN PERFORM OIL SAMPLE-BASED ANALYSIS but fail to take best advantage of the information when scheduling oil changes. That’s not necessarily bad, but in economic terms this is worth maybe 10% of the total value that the endeavor should provide.
I’ve informally polled both providers and recipients of the oil analysis data about what it would take to move this craft away from its typical use as a tool to drive oil changes and toward its use as a frontline machine health analysis and management option. Two interrelated themes seem to be repeated: better knowledge and doing a better job of applying the results.
The first goes without saying but not necessarily just for the end-user. If either the customer or the lab lacks proper training and skills, the customer suffers with poor quality results and little to no respect for the analytical technique. (
See the Author’s Note for a specific example of this reality).
Author’s Note: I was recently in Africa providing training for a mining company. During class discussions, one of the students expressed apathy toward oil analysis as a useful tool because the results were untimely and vague. I pressed for specific examples and was provided with a report that included the following data (
see Figure 1):
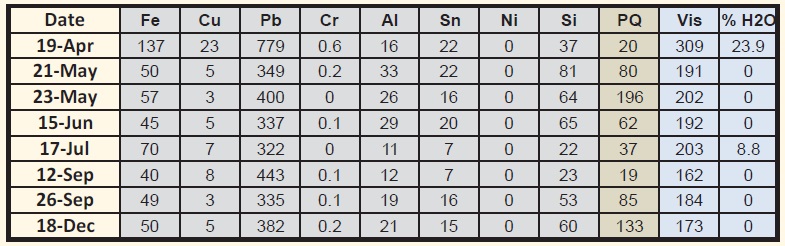 Figure 1. Actual data for the feed end trunion bearing in a ball mill.
The spectrographic detail included the standard 18 elements. There was no particle count, no units for moisture and NV and NV/Zn is provided without explanation. The viscosity and the PQ (particle quantifier) values are placed in a bar graph. Otherwise, no trending was provided on wear metals. The average interval between receipt of data and generation of the report was 10 days, with a range between a one-day and 16-day turnaround time.
The most curious thing was the commentary. In all instances, except the first sample date, the statements “wear is normal” and “no further action required” were provided. The statement for the first date was modified to reflect “water is high” (also reflected in the July 17 results), “viscosity is high,” “wear is high” and finally “rusting noted.” The suggested action for the first date was “remove water and seal out further entry.” Otherwise, there was no suggested action step other than continue sampling.
This is a ball-mill main trunion bearing and is made with leaded babbitt. The shaft is steel. It is evident from the extraordinarily large amount of lead (Pb) and silicon (Si) that the mill is full of atmospheric contaminants and is grinding itself to dust. The bearing is well on its way to replacement. There were several other mill bearings that were demonstrating similar analysis results and were similarly being ignored by the lab. Based on this and other examples of customer data from the same lab, the lab was not capable of performing quality machine condition analysis. Fortunately, the site personnel questioned whether the analysis provider was serving the company well.
Tabular data is difficult to read and interpret without some skill level. The results provided by the lab were exclusively either tabular data or commentary. Imagine how management might have viewed the data differently if the data were treated with the proper alarm settings and the results were reported in financial terms, as suggested in the balance of this article.
The second point is less obvious, but is in my mind the critical point for bringing oil analysis to the forefront for machine reliability management. I believe that the data recipient (the customer) can help solve this challenge by re-reporting the lab’s data for machine condition and contamination control in financial terms that reflect the state of urgency for the machine. In other words, instead of a table full of data for the component being analyzed, use statistical values to grade the machine wear data and report the results in terms of the cost of repair. Providing the cost impact should, at a minimum, improve senior-level attention to the information, which should create a demand to do a better job using this information for work planning.
This article outlines a set of steps that asset managers can follow to assign an economic risk value to each machine under lubrication-based condition analysis that will enable senior operations and financial management to review the data in production and financial impact terms.
CONDITION MONITORING
In order to move from tabular data to a financial valuation reporting model, several program design conditions must be fulfilled. First, it is essential that the practitioner and the laboratory agree that the high value proposition for the analysis program is machine condition assessment, not oil change management.
Second, following this purpose, essential design considerations are needed to convert this activity into a machinery focused effort, including:
1.
Clearly identify the machine (to be tested) by make, model and prime lubricant-protected components and types.
2.
Determine the rebuild cost and production loss risk basis for each machine under analysis and prorate the repair and production loss values according to statistical levels for wear debris generation (+6 sigma = 100% of rebuild cost, +3 sigma = 10% of rebuild cost, etc.).
3.
Establish a test slate that is appropriate for diagnosing machine wear, sump contamination load and lubricant condition and driven by quality instead of sample price.
4.
Establish alarm types and limits that are appropriate for each test (absolute, percentage and statistical alarms) according to test method and use these limits to set machine-specific alarms.
5.
Establish the best presentation format for rapid identification and review of data.
6.
Engage the lab and the plant IT department so that a dashboard design can be created, commissioned and implemented.
It’s pointless to try to establish a cost implication for a degraded state if the mechanism for grading the data isn’t rigorously defined. This isn’t complicated, but it does require that the practitioner have a system that is well designed to use the inputs in grading the data and reporting a final implication. As suppliers, we need to promote a more sophisticated model of analysis (customized alarms, statistics, factoring, etc.). As consumers, we need to ask the lab techs if they can provide a more sophisticated approach than what appears to be the default state.
A few commercial labs have extensive computational capacity and flexibility within their LIMS (Laboratory Information Management Systems). Regrettably, customers rarely know enough about the lab capabilities to take full advantage of those capacities.
MACHINE ANALYSIS
Most manufacturers conducting sampling programs are also actively engaged in vibration, thermography, ultrasonic energy and motor current evaluation techniques. The best example of properly defined machine evaluation parameters probably exists within vibration-based techniques.
A significant amount of time and attention is invested into setting up the machine database within vibration analysis software systems. It is widely accepted that one cannot simply drop a sensor onto a machine, punch a few buttons to gather some energy readings and then project a finding based on observation of the data. Perhaps this could work vaguely if the machine is in a grossly poor state and the objective of the analysis is to render a pass/fail verdict to determine if a rebuild is required. Fortunately, that isn’t what happens with vibration programs.
Vibration-based technologies are never “free for use with the purchase of…” as is often the case with lubricant supplier-provided oil analysis programs. There is a hefty capital outlay to purchase the software and hardware and accordingly a rigorous justification, often including a projected return on investment (ROI) expected in the planning stage. The practitioner, therefore, is expected to be rigorous and technically accurate in setting up the database that will be used to determine what the data readings mean.
With vibration programs, each machine is identified by machine type, make, model, criticality, speed, speed-range and load parameters. Machine criticality and operation cost-risk parameters are often provided as inputs. Each discrete bearing is identified according to its design and performance characteristics. Specific energy frequencies that pertain to that bearing’s failure modes are accessed from a component database and attached to the machine components. Gear parameters, including dimensions of the wheel and individual teeth, the number of teeth in a set and the speed of each gear set, are all considered to be appropriate details for the proper definition of the machine before the first reading is dropped into the database.
By contrast, and this is often the case, once the ink is dry on the lube supply agreement, a box of sample bottles is sent to the customer and the green light is given to begin sending samples. Samples arrive at the lab with little more than tacit details (machine asset number, machine name and machine manufacturer name and sump type (gearbox, hydraulic system, engine, bearing and compressor) and sometimes with no details. The lab is expected to create an entry for the machine and begin the analysis process without much more than a hint of machine design details. Consequently, labs often reflect upon that which is inherently safe for the lab (i.e., oil health parameters). The typically low level of provided machine information encourages the lab to make vague, superficial and safe statements about machine health.
To design the machine health focus, the customer must provide the following machine setup details:
1.
Machine type (compressor, engine, gearbox, etc.).
2.
Machine manufacturer name.
3.
Machine model number (used to aggregate data for statistical analysis).
4.
(Essential) component or sump name (if more than one per machine).
5.
(Essential) lubricated component type element bearing, plain bearing, helical gear, worm gear, hypoid gear, etc. (used to aggregate data for statistical analysis).
6.
Lubricated component model or series number (if known).
7.
(Essential) component composition (type and percentage of each metal used in each machine component in the sump).
8.
Filtration capability, including element quality.
9.
(Essential) lubricant manufacturer name.
10.
(Essential) lubricant brand (if different from manufacturer name).
11.
(Essential) lubricant type (EP gear oil).
12.
(Essential) lubricant grade (ISO 320).
The machine owner should also provide an update with the following types of details with each sample shipped to the lab:
1.
Confirm the lubricant manufacturer, brand, type and grade is still in use.
2.
Provide new details if the lubricant manufacturer, brand, type and grade has changed.
3.
Provide use-hours on the sump since its installation.
4.
Provide information on any filtration activities that have occurred.
5.
Provide filter element quality changes, if any.
6.
Provide any operational details that are not routine (i.e., completed a two-week outage, replaced the pump, replaced the bearings, overhauled the engine, etc.).
The essential details must be provided. Otherwise, there is little chance of returning a useful recommendation. The greater the amount of provided detail, the better the quality of the projection in the final summary.
TEST SLATE SELECTION
Once the lubricated component has been clearly defined, it’s appropriate to establish the test slate, alarm types and alarm limits for that component. Previously, we discussed a proposed test slate for machines based on machine type in the
May and
July 2009 issues of TLT (available digitally at
www.stle.org).
Often the test slate is picked based on its price and is applied incorrectly to components in order to fit the budget. It is reasonable to have a budget, but the budget should not be the central point of consideration on test slate selection.
As one would anticipate, the test slate for each type of machine varies some but not a great amount. The test types can be divided into three areas of focus: machine condition, sump condition and lubricant health, each with a few particularly useful tests.
Machine condition. Machine condition depends on spectrometric methods to look at small-particle wear metal concentrations, ferrous density analysis to look at large-particle wear metal concentrations and analytical ferrorgraphy to characterize the nature of the wear states.
Sump condition. Sump condition depends on particle counts, moisture analysis, varnish analysis and to a slight extent FTIR and AN measurement. It is not common for labs to conduct particle counts on high viscosity oils (largely because it is problematic for them), but this is a critical element of the sump condition analysis and should be included.
Lubricant health. Lubricant health depends on viscosity, FTIR spectroscopy, acid/base number, LSV (voltammetry) and to a lesser extent RPVOT and demulsibility testing.
The far right column in Figure 2 includes the proposed type of alarm that would be applied to each of these tests.
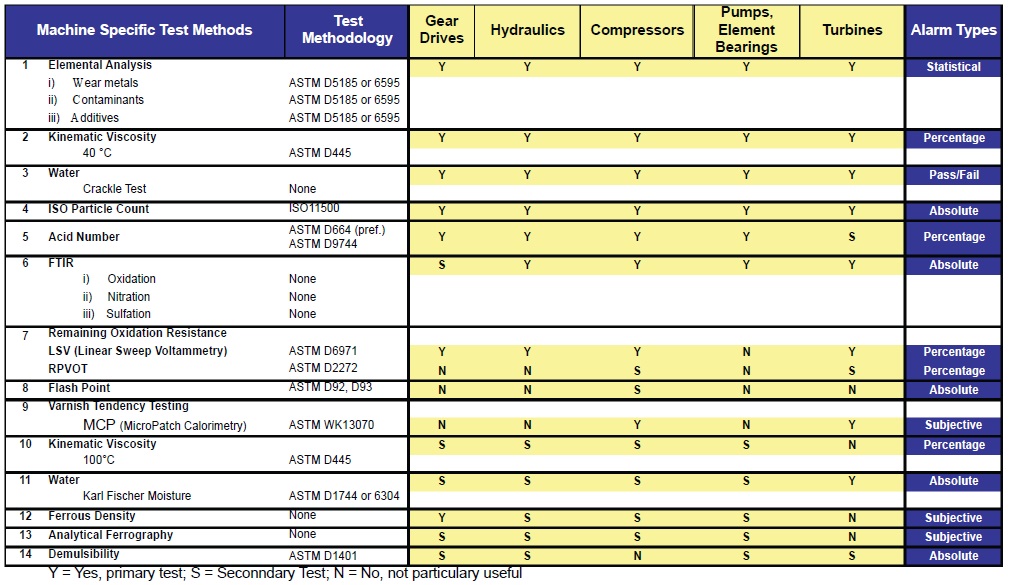 Figure 2. Primary and secondary test slates for common non-automotive applications.
ALARM LIMIT PARAMETERS
Figure 2. Primary and secondary test slates for common non-automotive applications.
ALARM LIMIT PARAMETERS
As is the case with other condition monitoring techniques, establishing appropriate alarm levels is every bit as important as deciding which tests to schedule. The alarm structure turns the data point into information that elicits a response.
Alarm types and limits are a combination of objective and subjective factors. There is no single structure that must be applied, and whichever structure is selected should be influenced by the machine’s criticality ranking: the higher the machine rank, the stricter the alarm profile should be.
In the
November 2009 TLT (available digitally at
www.stle.org), we reviewed alarm types and setting parameters. Following are three distinct types of alarm values:
Absolute Alarms (aka Goal-Based Alarms). Absolute alarms are intended to provide limits representing performance goals. These typically are used for measure and management of contamination (primarily) and lubricant health (secondarily). These alarms set the limits that the engineer believes to be acceptable, knowing that if the value is exceeded, the machine will continue to run but will be operating in a state that limits machine lifecycle. Figure 3 provides an example of how absolute alarm structures can be applied to a hydraulic circuit. If the hydraulic circuit is critical to plant performance, the actual values can be reduced to create a tighter alarm structure. Conversely, the parameters can be relaxed if the system has a low criticality ranking.
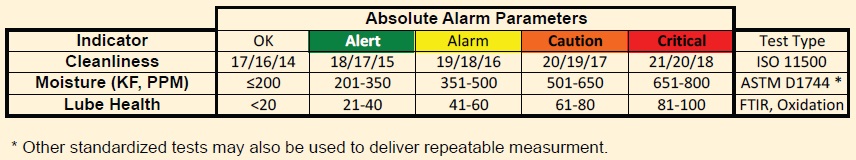 Figure 3. Example of the use of absolute alarm parameters to create an alarm profile, complete with color-coding.
Percentage Alarms.
Figure 3. Example of the use of absolute alarm parameters to create an alarm profile, complete with color-coding.
Percentage Alarms. Percentage alarms are typically applied to lubricant health parameters where change from the fundamental starting point represents risk to the machine. Viscosity at 40 C has a finite starting point, which varies from shipment to shipment, but the variation should be small. As the lubricant ages, the value changes for a variety of reasons: additives are consumed, oil becomes thicker as it oxidizes, and it generates a variety of acids as it oxidizes. The lubricant loses its ability to protect machine surfaces as these changes occur.
Accordingly, it would be useful to track the gradual (or rapid as the case may be) failure of the lubricant to limit machine health risk. As the measurement moves away from the initial value, either increasing or decreasing, the risk increases for the machine. A percentage deviation can be applied to reflect the extent of risk that is present. This type of structure is illustrated in Figure 4 for oil viscosity, additive concentration (by spectroscopy) and chemical degradation (by AN/BN). There are differences of opinion as to where these percentage values should be set. Each point of measurement is keyed to the in-service lubricant’s starting point, so some flexibility is warranted.
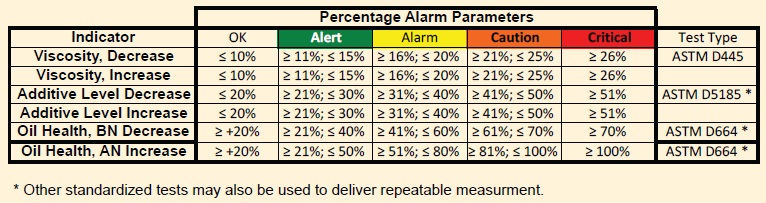 Figure 4. Example of the use of percentage-based alarm parameters to create an alarm profi le, complete with color-coding.
Also, it is reasonable to make adjustments to the ranges according to machine type. A diesel engine, for instance, could have tighter values across the board if the engine is operating with dirty (high sulfur content) fuel and/or is under continuous demand and cannot be pulled from service without extended planning. Given the normally high operating temperatures for diesel engines, the rate of change will be much greater than for a hydraulic system or gear drive. The increased risk should be reflected in the normal alarm parameters.
Statistical Alarms. Statistical alarms should always be used when evaluating machines for wear.
The reason for this is simple—different machine types wear at different rates. And, within a specific machine type, make and model wear rates differ according to operating conditions.
It is common for labs to aggregate data for a machine type (for example, gearboxes) and assign normal values based on a large and unknown variety of gearboxes operating in a large and unknown variety of conditions. This approach creates arbitrary alarms that produce confusion in the analysis results and mistakes in work planning. This all-to-common approach is one of the reasons that companies do not trust oil analysis as a central feature in machine health management.
Statistical alarms were presented along with other alarm methods in the
November 2009 issue (available digitally at
www.stle.org). This alarm type should be used for reporting change in wear metals (by each type) reflecting the number of standard deviations (if any) above the mean for each metal.
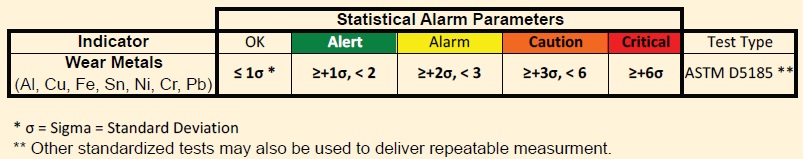 Figure 5. Wear metals alarm structure based on statistically-derived mean and standard deviation intervals.
For instance, for a specific gearbox:
•
If the iron concentration in parts per million is less than one standard deviation (for a population of this specific make and model gearbox) above the mean, the gearbox is rated as
‘Normal’.
•
If the iron count is equal to or greater than one standard deviation for the specific population of this make and model gearbox, but less than two, a green
‘Alert’ alarm is assigned to this data reading.
•
If the concentration is at or above two standard deviations, but less than three, the iron value is assigned a yellow
‘Alarm’ flag.
•
If the concentration is at or above three standard deviations, but less than six, iron is assigned an orange
‘Caution’ flag.
•
At or above six standard deviations, it is assigned a red
‘Critical’ flag.
The alarm structure described here is shown in a machine example in Figure 6. The wear data from an Aquamaster UUC335 positioning drive shows what appears to be a low Fe value at 57 ppm, but is in reality sitting just below the +3 sigma value—indicating that a significant problem exists for this drive.
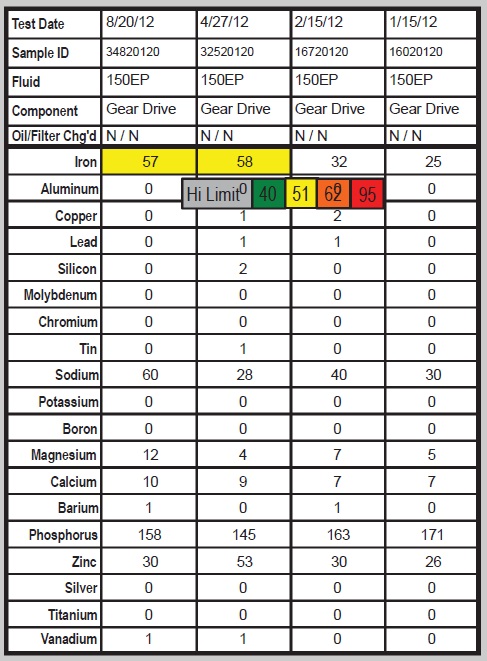 Figure 6. A ‘Caution’ level alarm with all statistical parameters displayed for a critical propulsion drive gearbox, as provided by Prescient© Lubricant Analysis Decision Engine.
The statistics in this example are based on 852 data sets for multiple UUC335 drives from eight production environments. Many labs would view a 57 ppm Fe result as a “normal” condition. The balance of the data shows this particular drive trending up sharply in these last four test results, up from the low single digits in the previous 10 sample results. This reducer isn’t supposed to be operating with this quantity of wear debris according to statistical measurements from the pool of data for similar drives. It isn’t in any immediate threat of catastrophic failure, but it is clearly on an aggressive failure mode. Even though it is only 57 ppm, it is reasonable to project that a costly repair will be required unless some type of action is taken.
The remaining question for this article is this: with well-defined machine parameters, proper tests and well-defined alarms and a clear pattern of impending failure, how can practitioners report the data such that senior management will take notice?
HIGH IMPACT DISPLAY
Tables of numbers are hard to intuitively grasp, and as overloaded as most reliability managers and technical specialists in the industrial environment are today, many don’t have time to draw the connection between the alarm state and the cost impact if no action is taken. The net effect is that machines reach a ‘Caution’ or ‘Critical’ condition characterized by a 3σ or 6σ state for wear debris and are ignored and fail while in operation.
To alleviate this tendency to systematically overlook the oil analysis data, the reliability engineer needs to associate the cost of an overhaul level repair to the alarm state. One of the details identified as essential in the first part of this article (along with the manufacturer make and model number) is the total cost of overhaul for each specific machine. Assuming that this number can be discovered, either by reviewing machine history or by getting a bid for overhaul, the engineer should use the rebuild value in the display information instead of a color indicator or numerical value.
DASHBOARD
The idea of a dashboard designed to provide instant analysis to nontechnical managers is not new. The hierarchal structure is simple. An icon is planted on the manager’s computer screen. The icon represents the most critical state reported in the most recent analysis for each machine under evaluation in each production department.
The results are aggregated by department, and the highest condition result is reported to the next level. As shown in Figure 7, Department C has five machines under analysis. The colors indicating alarm state are reported in the display. The color scheme follows the carefully defined alarm states as discussed above. Only one of the five machines has a ‘Critical’ alarm state, and, therefore, this most severe machine condition is reported to the department level.
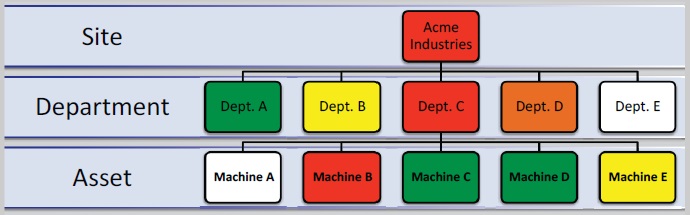 Figure 7. A simple overall display provides site management with a clear indication of the machine health states.
The other departments have machines at varying states, but in this example none of the other departments shows a critical (red) indicator. Department D has at least one machine in a ‘Caution’ alarm state, as evidenced by the orange indicator, but no machines in critical alarms. Department B has at least one machine in an ‘Alarm’ condition demonstrated by the yellow indicator, but nothing in either caution or critical condition, and the logic continues.
The top “site” level is an amalgam of all results and reflects the most severe machine conditions from each department. The critical condition from Department C takes precedence over other condition states and is, therefore, reported to the top level.
Back to the bottom level, if one clicks on the icon for Machine B then additional detail would be provided. As seen in Figure 8, Machine B has a red flag because a critical alarm was exceeded for the machine health alarm set, and if the observer clicks on this alarm state an HTML version of the analysis report could be displayed providing the actual data. For work scheduling purposes, the reliability engineer needs access to the actual data in order to know what specific issues have to be addressed to restore machine health.
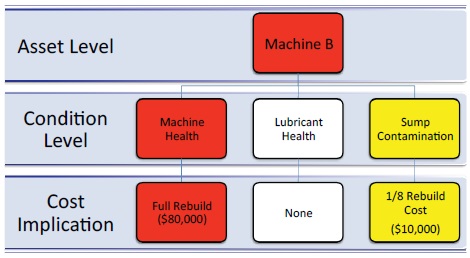 Figure 8. Clicking on the icon for Machine B provides additional details and provides a cost impact, but no discrete data.
The financial cost implication for Machine B is also shown in Figure 8. Each site would establish its own financial impact-to-alarm-state values according to what seems right for each machine type. In this example, Machine B has a historical $80,000 rebuild cost. For a 6σ alarm state for machine health, management may assume that the machine is beyond saving and the full rebuild cost would be applied. If the condition reflected a 3σ state, management may assume that, if spent now, only a quarter or half of the rebuild state or $20,000 to $40,000 would be required to correct the condition. Further, management may chose to assign production lost-time risk values and/or cost values for the different alarm states according to site knowledge about the machines and the expected costs to address alarm parameters.
Following this logic, if Figure 8 is recast to include hypothetical costs associated with the various alarm states, then management sees a very different picture—one that shows the actual impact of the current state of the machine lubrication program condition. Figure 9 brings all levels of display together, including the cost implication of the Machine B condition along with all other machine results rolled to the department and plant level, with the total cost aggregated at the top level.
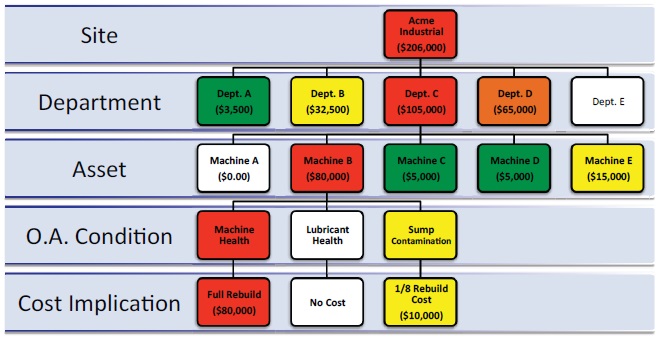 Figure 9. Display of machine condition and the financial impact of machine condition for the entire machine analysis program.
SUMMARY
Figure 9. Display of machine condition and the financial impact of machine condition for the entire machine analysis program.
SUMMARY
Oil analysis can become an essential element in ongoing plant management discussion if the available data is converted into information that matters to them.
It is typically difficult to integrate oil analysis data into productivity management discussions because of the way data is presented. However, if the data is recast into more financial (and productivity risk) terms, given that senior management is interested in controlling costs and minimizing risk, the results may draw more attention.
Translating the technical verbiage found in vibration, thermography and oil analysis report results into financial terms is a circuitous path but one worth following. The design and setup steps are straightforward and are stated in the beginning of this article. Following the steps will assure that the results are vetted to eliminate spurious information. The use of color-coding and assignment of the cost implications make the data much more easily understood. Other condition monitoring output should be converted into this type of display and integrated, if possible.
 Mike Johnson, CLS, CMRP, MLT II, MLA III, is the principal consultant for Advanced Machine Reliability Resources, in Franklin, Tenn. You can reach him at mike.johnson@precisionlubrication.com
.