Maximizing the benefits of fluid analysis
Jean Van Rensselar, Contributing Editor | TLT Feature Article July 2012
The secret? The lab and customer must work together. Here’s how to do it.
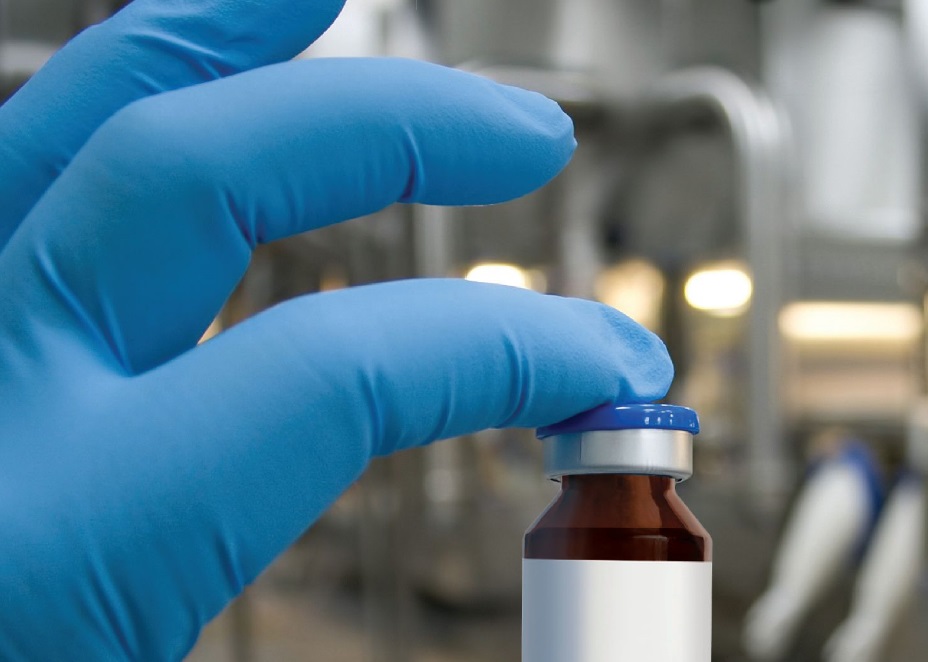
www.canstockphoto.com
KEY CONCEPTS
•
A well-executed fluid analysis program nearly always produces ROI.
•
Many customers don’t get the full benefit of fluid analysis programs because they’re not following correct procedures or following up on the test results.
•
A suite of condition monitoring tests are available that complement each other and tell the most complete story.
THE MOST BENEFICIAL OIL ANALYSIS PROGRAMS result from a collaborative effort on the part of the lab and its customer. This means that roles and expectations are clearly defined and agreed on and each performs assigned responsibilities.
In a perfect world, the customer would (1.) have a comprehensive oil analysis program in place, (2.) follow sampling protocol to the letter, (3.) read the full report and (4.) follow through on the recommendations.
In a perfect world, the lab would help the customer (1.) design the oil analysis program, (2.) suggest a sampling protocol in line with budget and needs and (3.) produce timely, easy-to-understand reports.
When customers say they aren’t seeing benefits from oil analysis programs, it’s often because they aren’t providing the lab with enough information and/or aren’t following through on recommendations. Equipment that could have been saved fails, and customers don’t make the connection. On the other hand, customers complain that labs recommend unnecessary tests, don’t interpret results in a way that they can understand and don’t provide enough guidance. A flawed fluid analysis program can be frustrating for the customer and the lab.
The analogy is often made between oil tests for equipment and blood tests for humans. It’s a good analogy in many respects but not so great in others. For example, the degree of criticality for pieces of equipment varies, but nearly all humans would consider their bodies essential. Companies have to pay for oil testing themselves while most humans have health insurance. If equipment fails, it can be replaced. If a human body fails…
A better analogy is a professional sports team. From a pure business perspective, each member of the team is an investment, with some paid tens of millions a year and others considerably less. Each member’s degree of importance to the success of the team varies and is based on such factors as past performance, current performance, age, the importance of the position and the existence of a reliable backup. Professional team members are in essence human machines that function in a system (the team).
The focus of team medical care is always on prevention and early intervention. This means continuously monitoring the physical condition of all members (with special attention to starters) identifying issues early and providing immediate follow-up care. The team medical staff accomplishes this through regular testing.
It’s the same with a company’s machinery. Routine fluid testing allows companies to catch minor problems in important equipment before they become major problems.
The goal of fluid analysis programs is to check the right equipment with the right tests at the right time and then follow through. When fluid analysis programs fail to live up to their expectations, the fault usually lies in one or more of five areas: overall strategy, sampling protocol, test selection, data processing and interpretation, and follow-through.
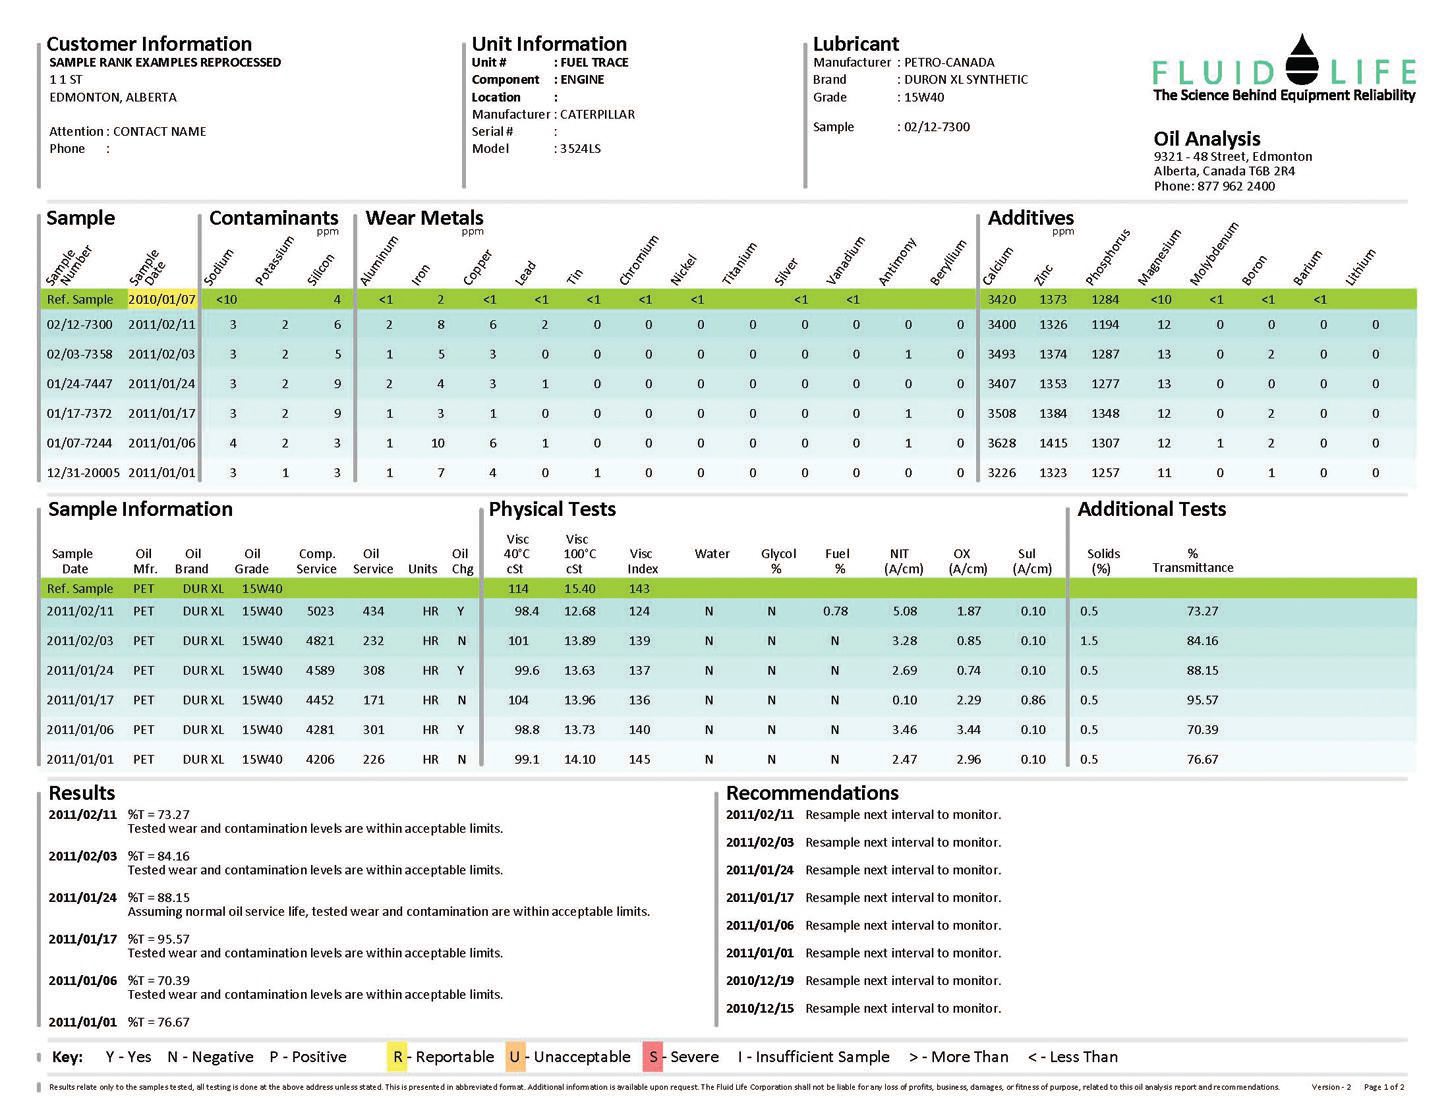 Figure 1. Sample Fluid Life report (Courtesy of Fluid Life Corp.)
How to select a lab
Assuming that an in-house testing facility is not an option (most small to mid-sized companies wouldn’t find this feasible), customers need to select the best lab to test their samples. Here are a few considerations:
•
Is the lab ISO 17025 accredited?
•
Do tests conform to ASTM standards?
•
Are lab employees appropriately educated and/or certified?
•
During what days and hours is the lab available?
•
How many locations does the lab have?
•
Can the lab handle the customer’s sample volume?
•
What are the report delivery and format options?
•
What kind of guidance/technical support can the customer expect?
•
Does the lab have the latest equipment and technology?
•
How many test methods are available—a full menu or just a few?
•
How well does the lab interpret data? (Ask to see a sample report.)
•
What is the turnaround time for results?
•
What kind of training programs does the lab offer?
•
What are the costs per test and what is/is not included?
•
What guarantees does the lab offer?
•
Is test selection preset, per industry and component type, but also flexible?
OVERALL STRATEGY
It is ultimately the customer’s responsibility to design a fluid analysis program that meets operational objectives. But this is an area where testing labs can help. A good starting point is to set simple but specific objectives (expected benefits) that will frame the program. Examples include:
•
Reduce equipment downtime by 15%.
•
Prolong equipment life by an average of 20%.
•
Extend oil change intervals 10% beyond current practices.
“This is where it all starts,” explains STLE-member Walt Huysman, oil analysis business development manager for Trico Corp. in Pittsburgh. “There should be written SMART goals (
see sidebar) that are visible for everyone to see. They must be measurable so you know if things are getting done.”
SMART Goals
SMART is an acronym for the elements of goals that lead up to the accomplishment of a specific task. These key performance indicators apply to nearly all disciplines, including fluid analysis programs.
The letters represent:
S (Specific)
M (Measurable)
A (Attainable)
R (Realistic)
T (Timely)
SMART goals first appeared in a November 1981 issue of Management Review in an article titled, “There’s a S.M.A.R.T. Way to Write Management’s Goals and Objectives” by George Doran, Arthur Miller and James Cunningham. For a synopsis, visit
here.
SELECT EQUIPMENT
The Criticality Index ranks a piece of equipment on how important it is to operations and thus how often and how extensively its fluids need to be tested. The index assigns one of three categories to each piece of equipment:
•
Critical. Because the rest of the operating environment can’t function without it, this equipment needs to be tested thoroughly and regularly.
•
Essential. This equipment is essential but not critical to the operating environment. This is often due to the fact that backup equipment exists. This equipment also needs to be tested regularly but not as often or as thoroughly as critical equipment.
•
General Purpose. Everything else falls into this category. This equipment is tested infrequently—less than monthly.
STLE-member Mark Minges, chief operating officer of POLARIS Laboratories, LLC, in Indianapolis, explains, “At POLARIS Laboratories, we like to have a complete equipment and component list before samples are even taken. Then we have the customer review the equipment database for accuracy and sign off that it is correct. This is critical for properly evaluating the data from samples. We then sit down with the customer and recommend a sampling frequency program for each sampled component based on their goals.”
CONTAMINATION SOURCES
Having background information on the equipment and operating conditions enables labs to test and report on specific contaminants. Knowing the possible sources of contamination, such as leaks, streamlines corrective action. STLE-member Evan Zabawski, senior reliability specialist for Fluid Life Corp. in Edmonton, Alberta, Canada, offers these examples:
•
Identifying the sampled component as having glycol/water cooling systems enables the lab to trigger checks for glycol in the oil. The secondary test will be triggered by elevated sodium, potassium and/or boron levels in the spectrographic analysis.
•
Identifying obvious sources of ingression, such as a turbine not being equipped with a steam gland seal system, means that you may expect higher-than-normal water content in a sample.
•
Identifying the process also indicates common contaminants. For example, the lab would set higher-than-average alarm levels on potassium for samples from a potash mine, as potash dust is expected, to some degree, in virtually all vented systems.
•
Identifying the environment also indicates common contaminants. For example, knowing the customer operates near a body of saltwater could be cause to set the alarm limits for sodium higher.
•
Identifying changes to the system. For example, installing a new oil cooler will account for elevated copper in the oil for about two months while the copper slowly oxidizes and forms its own protective layer.
FOLLOW-THROUGH PROCEDURES
A key aspect of strategy development that is often overlooked is identifying a set of follow-through procedures to implement in the event the lab report requires action. For example:
•
Who will determine the cost/ benefit of taking action?
•
Who will oversee the action?
•
Who will conduct the action?
•
How will the action be documented?
Once the strategy is in place and before initiating the fluid analysis program, the customer should record a benchmark or baseline for each piece of equipment. This baseline will include such information as overall reliability, past failures and the current oil condition. Much of this information will come from maintenance reports. Once the program is underway, these benchmarks become important for estimating the program’s return on investment.
“Most programs I see have never been benchmarked,” Huysman says. “This is a critical step if users want their program to improve—they need to know where they are first so they can plot a course for where they want to be.”
SAMPLING PROTOCOL
Establishing sampling protocol is another area that is ultimately the customer’s responsibility but where the lab can help. In addition to suggesting equipment, specific tests and test frequency, the lab can provide clear guidance on correct sample labeling such as the oil type, number of hours the oil has been used and the presence of additional oil that has been added since the last oil change.
SAMPLING METHODOLOGY
Failing to choose the right equipment and not sampling with the best methods are two areas that set up fluid analysis programs for failure. Many customers only test the oil when a problem is obvious—sometimes without identifying a baseline in advance. By then it’s often too late.
Once the most logical equipment and frequencies have been identified, the sample procedure itself is the primary consideration. There are two basic sample locations—the drain port or a dedicated sample valve. Although the drain port is the source of the vast majority of all fluid samples, it is most likely to produce a contaminated sample. Ideally samples should be collected in a dedicated sample valve that is free of possible contamination sources. The lab can help with sampling protocol.
“Improper sampling starts the whole process of misleading information,” Huysman says. “The lab must assume the sample was taken properly, but the results are only as good as the quality of the sample. Users need to get training on sampling techniques and proper sampling locations.”
COMPLETE INFORMATION
Providing complete sample information requested by the lab is also the customer’s responsibility. The lab will probably keep a history on all the equipment it has tested, but it is not a complete record of the equipment. For example, the lab will not have any information on the machine’s history prior to the start of the testing program. This is why it’s so important not only to keep a detailed history on each piece of equipment but to provide the necessary information on the fluid sample. This information should include anything unusual that has taken place since the last sample.
“A complete and up-to-date equipment list is a good starting point,” Huysman says. “Equipment information, lubricant information, reservoir capacity and filtration information are all important to know, and this information should be provided to the lab and updated as needed.”
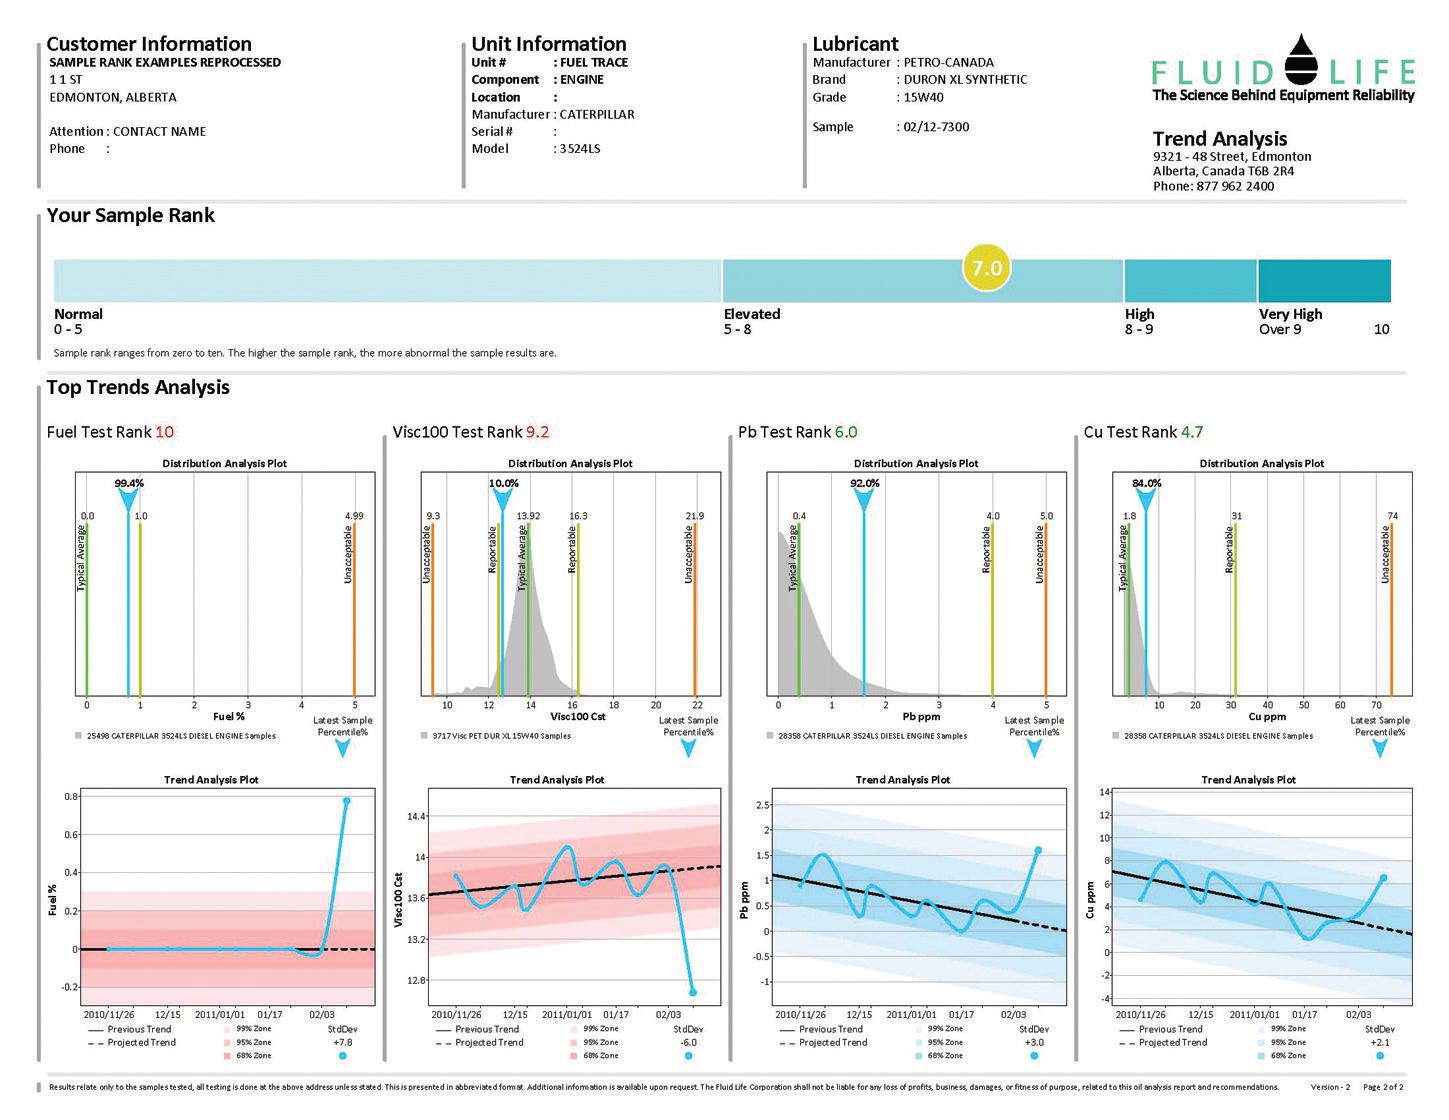 Figure 2. Sample Fluid Life report showing histograms and trending (Courtesy of Fluid Life Corp.)
TEST SELECTION AND FREQUENCY
No matter how proactive the lab, the customer will always know the equipment and the environment in which it operates better than the lab. But the lab has expertise in the latest, most cost-effective tests and techniques and their applications. Because of this, the customer will always make the final decision on tests and their frequency, but the lab is an indispensable source of advice.
RELEVANT TESTS AND FREQUENCIES
This is an area where the lab can be extremely helpful. The customer should discuss objectives with the lab and then go through the equipment list to identify specific tests and frequencies. If there is a question about the necessity of a specific test, the customer should ask for clarification.
“Doing the amount of testing necessary to cover all possible issues is not cost effective,” Minges says. “First of all, fluid testing will not cover all possible issues just as vibration analysis, thermography or ultrasonic leak testing cannot detect all possible issues. Ideally, the lab prescribes a testing regime to cover most possible issues and then uses trigger alarms to order additional testing based on what is found in the original results. It’s a drill-down approach; if this tests high, order this test and so on. That way we can cover most possibilities. It is important for the user to understand that there are limitations to every laboratory testing method and it is in their best interests to ask the laboratory about these during the sales process.”
TREND ANALYSIS
Because of cost considerations, customers usually don’t order tests frequently enough. Ways around this during tight financial times are narrowing the scope of the tests (testing only for essentials) or performing basic tests in-house.
“Not all labs issue reports with proper trending,” Zabawski says. “This is to the detriment of the user. Furthermore, users do not always take it upon themselves to further manipulate the data they have received. Trending is significantly more important than the absolute values.”
Lab quality control—ISO/IEC 17025
ISO/IEC 17025: General Requirements for the Competence of Testing and Calibration Laboratories
ISO/IEC 17025 is the main standard for testing and calibration laboratories. It was initially issued by the International Organization for Standardization (ISO) in 1999. The two main sections in ISO/IEC 17025 are
Management Requirements and Technical Requirements. Management Requirements address the lab’s operation and the effectiveness of the quality management system. Technical Requirements address the correctness and reliability of the tests and also the calibrations performed in the lab.
For a laboratory to become accredited, it must have a documented quality management system. More important, the lab must undergo a full-scale audit of each parameter it wants to have accredited. If a lab accredits only one test, it has the right to display an ISO 17025 certification. But the better labs are accredited to a rigorous program of 30-60 different tests per location.
To retain accreditation, labs must also participate in independent round robins. If they fail two in a row, they automatically lose their accreditation for that parameter and must start over. Audits are recurring, and round robins for all accredited parameters are continually reported to the accreditation body (i.e., ASTM) in order to ensure continued compliance.
TEST INTEGRATION
When it comes to the most critical machinery, it makes sense to supplement oil analysis with other condition monitoring technologies such as vibration analysis, thermography and ultrasound.
“I have been to many operations where fluid testing is done and the data is looked at by the lube guys. Vibration is being done and looked at by the reliability guys. The groups don’t always seem to talk to each other,” Minges says. “All condition monitoring data should be reviewed by the same people; otherwise something is going to get missed. All of these condition monitoring techniques complement each other. Looking at all of the data together tells a much more complete story.”
Tests that should be examined in total include the following:
Vibration analysis. Oil analysis and vibration analysis complement each other almost perfectly. Vibration analysis monitors and controls balance, looseness and alignment. Oil analysis monitors and controls lubricant quality and contamination. Vibration analysis excels at precisely detecting impending failures in high-speed bearing systems.
Thermography. The premise behind thermography is that an increase in heat indicates failing components. This is especially true for electrical contacts and terminals. Thermography also detects issues that oil analysis can’t, such as the level of deposit buildup in storage tanks and the condition of rollers, couplings and high-speed bearings.
Ultrasound. Ultrasound uses digital meters that measure high-frequency signals from bearings and display the result in decibels per microvolt. Trending values will point to potential bearing defects caused by contact conditions such as rubbing and friction. Ultrasound complements vibration analysis well.
Visual inspection conducted by a seasoned machine operator looking for such conditions as cracks, leaks and rust is surprisingly effective but not foolproof. Another in-house test is performance analysis, which involves comparing actual operating statistics with the manufacturer’s original parameters. Newer test technologies include motor current analysis, stress wave analysis and embedded sensors that can detect wear debris and/or vibration.
Trico Corp. specializes in direct reading ferrography and analytical ferrography. Huysman explains, “Analytical ferrography is what I call the CSI of oil analysis (we wrote the book on these tests). Our TLM process (total lubrication management) is basically a cradle-to-grave approach to lubricant handling and management.”
DATA INTERPRETATION
Once the samples have gone to the lab and the results are back, the customer needs to interpret the data and decide on a course of action. The lab will explain the actual statistics and what they mean, but it’s the customer’s job to weigh those results with other factors (such as running conditions) and follow through where necessary.
Ideally, the samples should be sent to the lab the same day the customer collects them. Waiting any longer compromises the integrity of the sample and also creates a delay in addressing any issues that the lab turns up. It’s best to overnight or hand-deliver samples where possible.
“Samples should be sent to the lab as soon as they are taken,” Huysman says. “Don’t wait until the box is full—remember that the equipment continues to wear. If you have a problem, you need to know about it before the equipment fails.”
Zabawski adds, “Logistics in getting the samples to the lab must be considered, whether the lab offers drop points for shipping or pre-addressed packaging with a reputable courier.”
Many labs promise the results within 24 hours after they receive the sample, but customers should expect results for routine tests in no more than 48 hours. If they are frequently receiving results more than 48 hours after the lab receives the sample, customers should consider changing labs.
Minges points out that there are exceptions because some tests take longer to perform. “The lab has no control over shipping time, so for the lab the clock is ticking from the time the sample is received,” he says. “For typical routine-type testing in most labs, the goal is 24-48 hours, ideally 24 hours. Our goal is to get 85% (of the results) to the customer in 24 hours and 98% within 48 hours. We do a lot of advanced testing on some samples, and some of this testing takes more than 48 hours, so 100% out in 48 hours is not realistic for some testing.”
UNDERSTANDING THE RESULTS
So what happens if the customer receives the results but doesn’t know what they mean? Most labs flag problem areas on reports based on statistical limits and also offer training in report interpretation—a service customers should take advantage of. Look for a lab that is accessible for questions at least during normal working hours and preferably beyond. Customers should feel comfortable contacting the lab for clarification and recommendations.
RELIABILITY
If customers have done their homework and checked for ISO certifications, they should be comfortable with the reliability of the reports the lab generates. The Fluid Life report format includes a comparison of each parameter to a histogram of identical or similar make/model/oil type samples. The histogram is based on hundreds to thousands of other recent samples and drives statistically-derived alarm limits. In addition, Fluid Life trends the last nine samples, which provides a solid basis for ranking the parameters and overall report. Zabawski explains, “For example, your results may be high compared to other similar systems, but if the last bunch of results are the same, that may be normal for this component and does not warrant significant alarm. This format enhances our level of interpretation and makes it easier for the user to read.”
FOLLOW THROUGH
While the lab can help with the first three areas, the responsibility for follow through rests directly with the customer. Customers who complain that they just aren’t seeing the ROI in fluid analysis are often the ones that fail to take advantage of the early warning fluid analysis provides.
“Too many times I have seen users simply file away their results without really looking at them,” Zabawski says. “Some users have trouble translating lab comments into action items, but mostly I see the planner or reliability engineer making a correct evaluation and then putting through a work order that a mechanic will not comply with because they do not believe in oil analysis.”
Huysman and Minges agree. “There are always two steps to resolving an equipment issue fixing the current issue and then following up to determine what the root cause was,” Huysman says. “If you fix the root cause, the problem should not return. Many times we get another sample and we can tell that nothing was done because the new sample is worse than the previous sample.”
Minges says, “What is the point of trying to treat lung cancer if the patient continues to smoke? Too often users of fluid analysis get a report back that clearly tells the user to perform maintenance on a unit that has very high potential of failure and the user just files the report away because he/she either doesn’t understand it or they don’t believe it or Operations won’t let them shut it down because it will lower production output. If this is the case, then why sample at all?”
“What typically happens in some of these cases is that failure to heed the recommendations results in machine failure and very high costs. Management reviews the fluid analysis data and makes personnel changes. Or managers act on the recommendations and have a major save, and then they will become believers and use the program effectively.”
 ‘Improper sampling starts the whole process of misleading information.’
MAXIMIZING ROI
‘Improper sampling starts the whole process of misleading information.’
MAXIMIZING ROI
Huysman says, “My opinion has always been you get what you pay for or not doing all the tests necessary in order to save money (expecting to get top dollar results for testing but not wanting to pay for it). Users should be considering oil analysis as an insurance policy to prevent downtime.”
Sometimes companies initiate fluid analysis programs and abandon them soon after, saying they just don’t see the return on investment. But often the fault is theirs. Following is a summation of ways to ensure that the oil analysis program more than pays for itself by prolonging the life of equipment, reducing downtime and preventing accidents:
•
Thoroughly document the history and current condition of all equipment that will be included in the fluid analysis program.
•
Work with the lab to choose the most logical equipment to monitor.
•
Work with the lab to choose the best tests and the optimal frequency.
•
Consider complementary tests such as vibration analysis on the most critical equipment.
•
Collect samples on schedule from a dedicated sample valve if possible, label them thoroughly and send them to the lab immediately.
•
Read the full report, follow up with the lab on anything unclear and take immediate action where warranted.
Like other quality labs, POLARIS is serious about demonstrating ROI. Its Field Services Department’s primary function is to help customer fluid analysis programs reach full potential. To that end, POLARIS conducts public training seminars that show people how to get more from their fluid analysis programs.
 Many customers only test the oil when a problem is obvious—by then it’s often too late.
“If I was the CFO of their company, and it was suggested to spend thousands of dollars on fluid analysis, I would be asking, ‘How much is this going to cost us and how much is this going to potentially save us as a company?’” Minges says. “Once they have an idea of what kind of ROI they would like to achieve, they can take this information to the lab, and if the potential savings significantly outweigh the costs then it is a no-brainer.”
The customer wants to get the most out of the tests and so does the lab. They have a vested interest in ensuring that the fluid analysis program tells the customer exactly what they need to know in order to keep the facility performing at its peak.
Zabawski advises, “Set a goal for the oil analysis program. For example, extend drain intervals, extend component rebuild intervals, increase reliability or uptime, and then assess its success regularly. Any condition-based monitoring program must be viewed as a savings and not a cost. If it isn’t saving you money, you’re not doing it right.”
 Jean Van Rensselar heads her own communication/public relations firm, Smart PR Communications, in Naperville, Ill. You can reach her at jean@smartprcommunications.com
.