Sample interval selection for optimum results
Mike Johnson, Contributing Editor | TLT Best Practices April 2012
Consider these four options before setting an oil sample frequency for your machine.
KEY CONCEPTS
•
Lubricant suppliers traditionally have established sample intervals as a value-added service to their customers.
•
Four parameters should be considered when setting sample frequency: rate of progression to failure, machine criticality ranking, environmental stress and machine health.
•
Each parameter is assigned a weighting value based on the importance that parameter holds for reliability management.
IMAGINE SITTING AT YOUR DESK AND YOU CLICK ON A WEB SITE THAT INSTANTLY BRINGS UP INFORMATION for each machine which accurately provides (1.) the current condition of the oil-lubricated components, (2.) the amount of corrosive water and abrasive particles in the oil, (3.) the relative health of the lubricant and (4.) data marked with alert and alarm highlights that are driven by either statistics or the site reliability engineer’s own thoughtful customized plan for machine management.
Unfortunately, many oil analysis users can only envision having the ability to have this valuable information available to them.
Of course, whether one can actually click and read the current, thorough, accurate state of lubricated machines or not is dependent on many interrelated details that must be addressed. Since January 2010 TLT has published a series of oil analysis articles that have provided an inside look at many of the discrete details, including test types, the best tests for a machine type, test slates, alarms and limits for those tests, representative and repeatable sample collection and advanced techniques for data analysis (Note: These articles are available digitally at
www.stle.org).
In each of these articles, there has been a purposeful focus on machine condition management first and oil health second. That is not to say that oil health is not important. Logically, if one is doing work that provides current, thorough, accurate machine condition information then one will have a design that provides thorough oil health information, as well. Given that oil chemical health is a homogenous property, the inverse of this statement is not necessarily true.
This article addresses setting a timely sample interval. Lubricant suppliers have traditionally established intervals as a value-added service to their customers. This isn’t right or wrong, but it is biased toward lubricant health and accordingly focuses on the low end of the value offering available from the effort—the oil change.
On a personal note, I practiced this as a lubricant supplier through the first 10 years of my career. My customers depended on me to test the oil and tell them if it needed to be changed. The oil was tested prior to usages and was often changed based on chemical degradation or contamination or presence of wear debris. My company did identify catastrophic conditions and pointed out some underlying root causes to be eliminated, but the central question was about the oil change.
For the last 15 years, I have seen a different (and higher) value for oil analysis practices: machine lifecycle improvement. To achieve lifecycle improvement, there must be current, thorough, accurate information available, which is dependent on properly addressing all of the key details, including sample frequency.
Sample intervals should be established through the use of an objective machine and operating context-specific decision process. We’ll discuss four separate considerations that should be used to influence the sample interval, as well as present a simple mathematical model for their effective use.
 Hydraulic systems, fan pumps, compressors, combustion engines and shaft bearings degrade more quickly than a gearbox and less quickly than a turbomachine.
LUBRICANT SAMPLE INTERVAL
Hydraulic systems, fan pumps, compressors, combustion engines and shaft bearings degrade more quickly than a gearbox and less quickly than a turbomachine.
LUBRICANT SAMPLE INTERVAL
Following are four parameters that should be considered for each machine when seeking to optimize its sample interval:
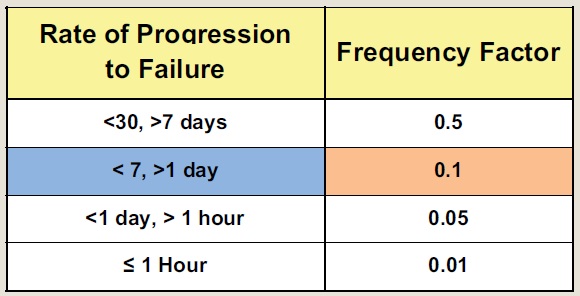
1. Rate of Progression to Failure (Fr). The rate at which a machine progresses from incipient failure to functional failure is the first criterion. This criterion represents how quickly a machine can move from uniformly healthy to the point of requiring repair or rebuild. In order to catch meaningful changes in the machine’s heath state, one must sample more frequently for those machines operating normally at high speeds.
For instance, a base-loaded turbine can degrade from uniformly healthy to scrap metal in a few seconds. Sensors that monitor the turbine’s operating state are designed to sample at fractions of a second and if a reading exceeds a value then initiate an emergency shutdown. For this reason, sampling a turbine on a monthly basis would probably prevent the reliability engineer from making any readings that could contribute tangibly to turbine health. A shorter interval would be warranted for oil sampling to contribute to the condition monitoring effort.
On the other hand, gear drives may take weeks to months to degrade because their shaft speeds are low (generally speaking). Even highly critical heavily loaded drives, such as a kiln drive, will degrade at a snail’s pace compared to a turbine or other turbomachines.
In addition, hydraulic systems, fan pumps, compressors, combustion engines and shaft bearings would degrade more quickly than a gearbox and less quickly than a turbomachine, but each machine has to be considered individually based on its own design and operation.
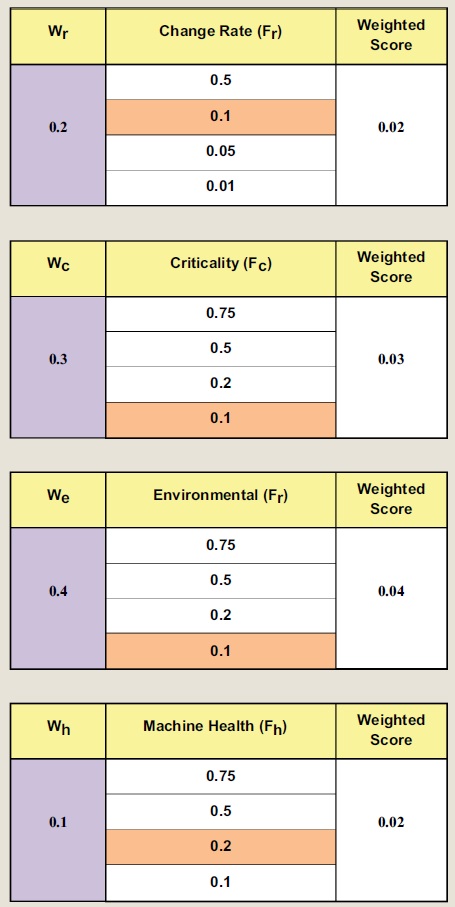
For the sake of creating a simple, easily understood and quickly implemented system, simple values have been chosen for a rate-to-failure factor and all other factors, as well. Table 1 provides an example of a hydraulic system operating at elevated pressure and is driven by a pressure compensating axial-piston pump. The machine’s failure rate is moderate, between a week and one day. Therefore the Failure Rate Frequency Factor is 0.1.
Table 1. Sample Factors for the Rate of Progression to Failure
 2. Machine Criticality Ranking (Fc).
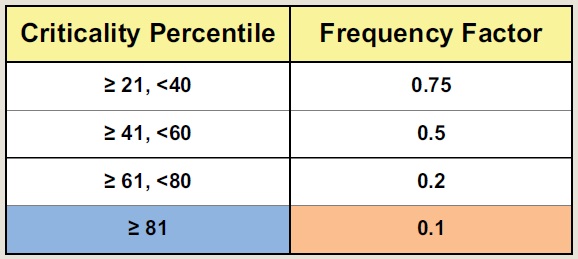
 This factor is determined by the plant’s systematic machine criticality ranking placement. A criticality ranking, or rating, is a value assigned to a machine that lets management know, at a glance, how important the machine is to a combination of performance interests.
At a minimum, the criticality ranking should include inputs for risk from environmental emissions, risk to public safety, risk to employee health and safety, financial risk from lost production and financial risk from costly repair. Other special risk circumstances may be added as needed. If a machine criticality assessment hasn’t been applied to a plant’s assets, then it should become an immediate and high priority. It is exceedingly difficult to efficiently allocate resources for machine care if it isn’t clear which assets have top priority.
A strong argument could be made for focusing expressly on the top 60% of the criticality profile and simply schedule the balance for systematic oil changes by machine operating time. Another strong argument could be made for conducting on-site analysis to some extent on the top 20%. The hydraulic system example from Table 1 is considered again in Table 2. This machine falls in the top 19% of assets in machine criticality. Therefore the machine criticality frequency factor is 0.1.
Table 2. Sample Factors for Machine Criticality Ranking - Fc
 3. Environmental Stress rating (Fe).
 This rating represents the level of influence that the worst-case contaminant condition can have on the machine and lubricant health. Since there are multiple contaminant influences, there are multiple parameters to consider.
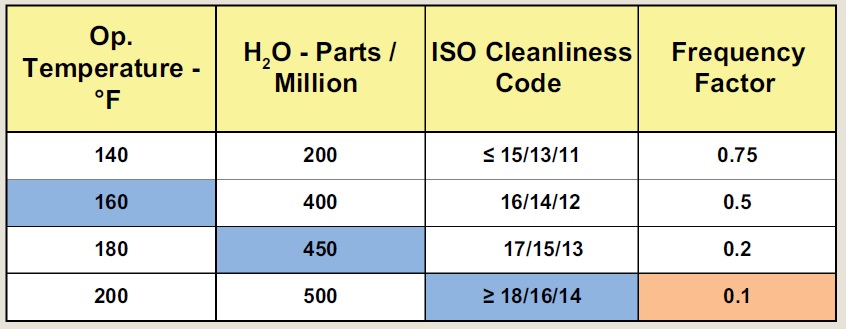
When the oil is cool and dry but very dirty, the dirt load, representing the most extreme condition, would determine the frequency factor (such as with a gear drive in a steel mill). When the oil is very hot and dry and clean, the heat, representing the most extreme condition, would determine the frequency factor (such as a gas turbine). When the oil is cool and clean but has high moisture influence, the moisture would dominate the decision (such as a paper mill). The parameters should be weighted for the plant site. Using the hydraulic example again, Table 3 shows three different conditions present in a machine sump. The blue highlights the cells with current contaminant conditions. Since the contamination load by particle count is the most severe, this condition determines which frequency factor to select. The environmental frequency factor is 0.1.
Table 3. Environmental Stress Rating - Fe
 4. Machine Health Status (Fh).
 This is a representation of the state of general health of the machine in its operating context based on commonly used condition monitoring metrics. As installation, balance, alignment, etc., improves, the interval for sampling will increase (as reflected by the declining value).
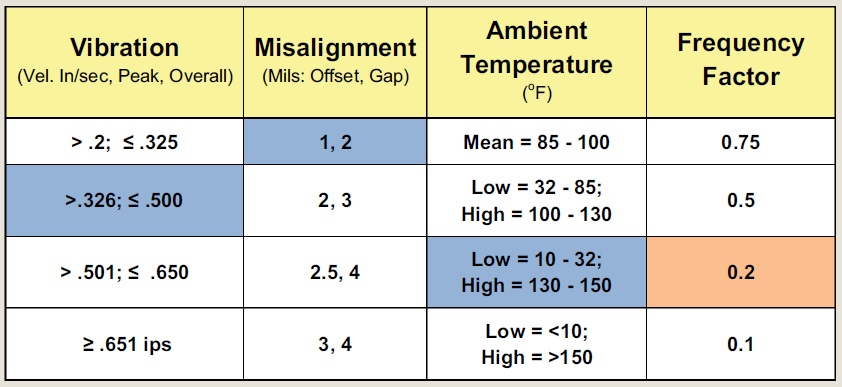
High vibration, high misalignment and/or high imbalance (all determined by vibration levels) or extremely high or low ambient temperature will produce low interval factors. Machine vibration values are provided in the units of velocity in inches per second (a measure of the rate of change in displacement), peak (maximum spectral value), overall (composite value). This value takes into account all vibration energy from a reading. Machine alignment values are provided in mills (.001 inches) of Gap (aka Rim, angular displacement between the axial planes) and Offset (parallel displacement between the axial planes). Temperature values reflect actual machine operating temperature ranges.
The blue highlights shown in Table 4 reflect the hydraulic system operating state where the overall vibration level is between .350 in./sec. velocity overall, the motor to pump component misalignment by 1.5 mils, and is operating at 140 F. Since the ambient temperature value is the most severe, it is used to determine the machine health frequency factor, at 0.2.
Table 4. Machine Operating State Frequency Factors.
 FREQUENCY FACTORS
Reliability centered maintenance philosophy asks the user to optimize maintenance actions relative to the importance of the machine’s mission. When the mission for a given machine is high, optimizing increases attention. If the mission is low, optimizing decreases attention. These factors are intended to optimize frequency based on the plant’s operation on any given day.
It is reasonable to assume that any company with multiple plant sites will have a wide variety of levels of maturity and effectiveness for selecting factors for any of these categories. The significant factors should be selected by local management to support local production priorities.
The significance factors represent the level of emphasis that management applies to each of the four frequency factors. The total of the significance values should equal 1, and any combination of values is acceptable. Each significance value is multiplied by the factor score to provide a weighted factor score. When added together, these will produce a Weighted Sample Factor (WSF), as follows:
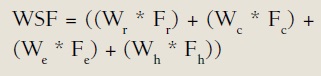
Where Wx = Weighting Value
Fx = Selected Factor
Table 5 shows weighting assigned to each of the four factor categories noted above.
Table 5. Weighted Operating Factors
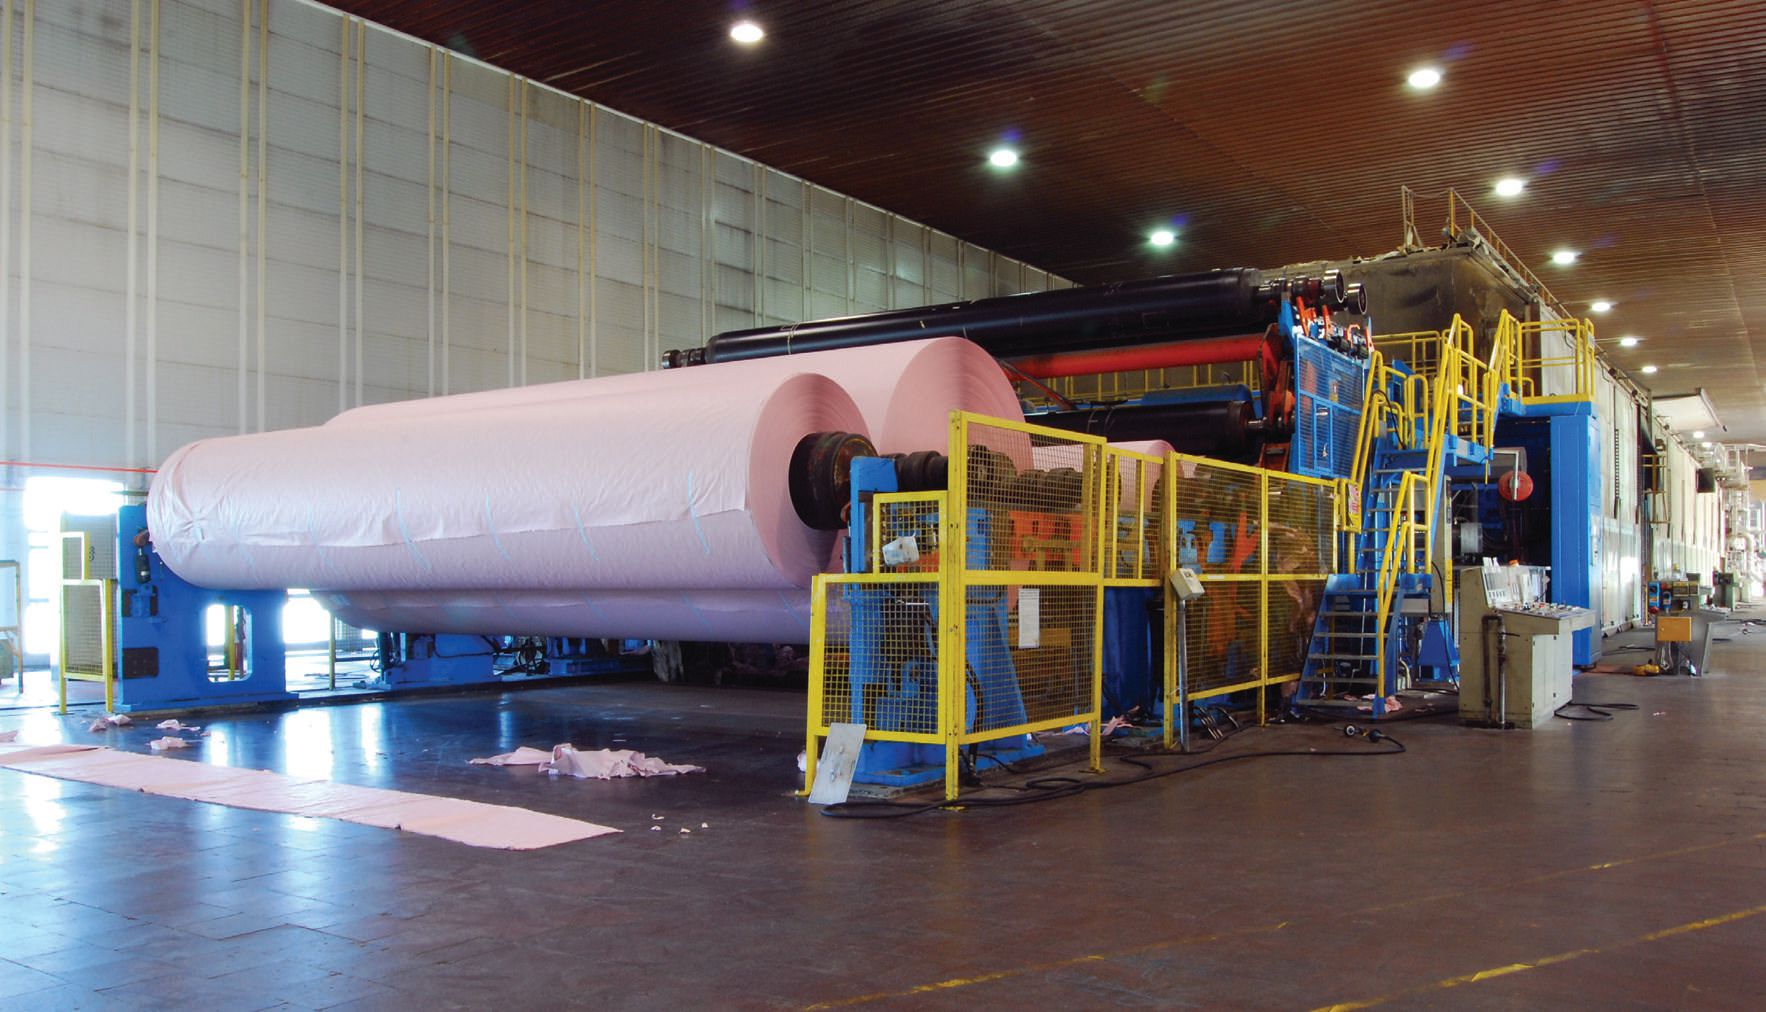
When the oil is cool and clean but has high moisture influence, the moisture would dominate the decision (such as a paper mill).
BASELINE SAMPLE INTERVAL
One might think that the lubricants industry has resolved to a maximum viable interval but that isn’t the case. Lubricant suppliers have established sample intervals for many programs. This isn’t right or wrong, but it is inherently biased toward lubricant health and focus on the lowest value proposition for the entire exercise: lubricant replacement. In a clearly visible way, it is assigning the fox to guard the hen house.
The base interval proposed for this method is 180 days, which is the longest reasonable interval that one would consider for oil sample collection, even if the objective is only to determine if it’s time to change oil or not. Additionally, the factor values are set to work with 180 days. If one chooses to follow the logic and create new, customized intervals that match more closely with company values, one could pick any default value that provides effective systematic results.
SAMPLE CALCULATION
The final step is to multiply the summed weighted factors by the default sample interval. In this example, the weighted factors equal 0.11. As shown in Table 6, this value multiplied by the default value of 180 days produces a corrected sample interval for the specific machine of 19.8 days.
Table 6. The final Sample Interval
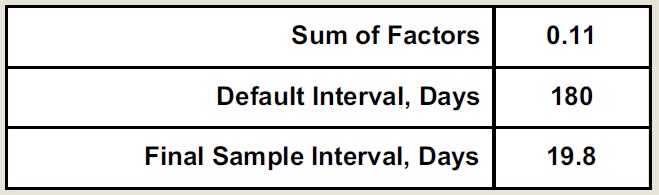
The final sample interval calculation is:
(WSF * Baseline) = Final Sample Frequency Interval, Days
For whatever reason, the calculated interval is not rational (cost, harsh operating conditions justify shorter basis, machine is not accessible, etc.), adjustments are made to support site goals and/or the reality of site limitations.
SUMMARY
Lubricant suppliers often set oil sample intervals. For better or worse, these intervals are driven by their company’s business needs—not by consideration for the needs of the machine and the customer’s enterprise.
Since the best use for oil analysis is as a machine and sump condition assessment tool, an objective and systematic approach should be used to strongly influence sample intervals.
There are four considerations that can be used to create interval discount factors for machines: (1.) rate of machine health progression from incipient failure to functional failure, (2.) criticality level, (3.) environmental stress conditions and (4.) overall health characteristic. These four considerations should be weighted for machine type and plant priorities, with the weights totaling one. Once weighted, a factor is selected for each of the considerations. As the condition defined by the factor progresses toward an extreme state, the associated discount number declines, producing a shorter interval.
After selecting intervals and multiplying the selected interval by the weighting value, the net values are added together. This final weighted value is multiplied by the default value, which is set at 180 days, to produce a realistic, reliability centered sample interval.

Mike Johnson, CLS, CMRP, MLTII, MLAIII, is the principal consultant for Advanced Machine Reliability Resources, in Franklin, Tenn. You can reach him at mike.johnson@precisionlubrication.com.