Optimizing lubrication effectiveness with ultrasonic monitoring
Mike Johnson, Contributing Editor | TLT Best Practices February 2012
Reliability engineers can measure surface rubbing in their machines with the proper data-collection techniques.
www.canstockphoto.com
KEY CONCEPTS
•
A compression wave is created by an impact event, which creates a high-frequency energy wave.
•
A technician’s ability to collect accurate ultrasonic energy is strongly influenced by housing size and mass, machine speeds, location of the sensor, data collection techniques and several other influences.
•
The use of permanent threaded or adhesive mounted studs provides the best possible high frequency collection response.
IN RECENT YEARS ULTRASONIC ANALYSIS HAS BECOME A POPULAR WAY TO TUNE AND IMPROVE GREASED BEARING LUBRICATION. There has been plenty of debate about the value and usefulness of this approach between companies selling instruments for high-frequency-domain vibration analysis and airborne ultrasound and consultants who have weighed in on the value of using standard engineering principles to establish optimum practices.
While machine condition analysis, including measurement for presence of a lubricating film, is useful in helping equipment owners determine the effectiveness of the lubricant film in machines with rolling contacts, ultrasonic energy measurement is useful in other ways, as well.
This article focuses on rolling contact interaction and the quality of the elastohydrodynamic oil film in oiled/ greased bearings. In a future article, we’ll discuss strategies for using ultrasonic energy measurement to improve the effectiveness of lubrication practices.
ASPERITIES & COMPRESSION WAVES
First, we’ll begin with a quick review on what is occurring inside the bearing housing, starting with the bearing surface. All element bearing surfaces appear rough when viewed through a microscope, as shown in Figure 1. The high spots are called asperities. In order for bearings to operate reliably, it is necessary to separate the asperities so they don’t interact. The average asperity height for an element bearing is between 0.2 and 0.4 microns. The combined height for two sets of surface asperities is between 0.4 and 0.8 microns, which is about the dimension of the loaded oil film (.5 to 1.5 microns).
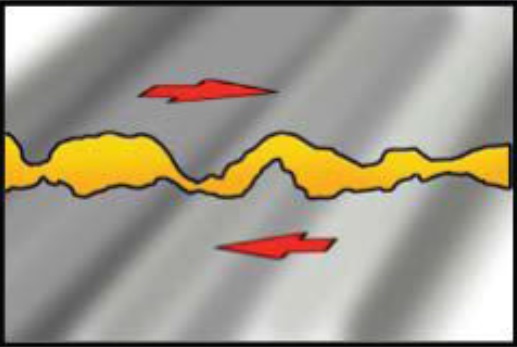 Figure 1. Typical surface micro-profile of an element bearing.
When surfaces roll together by design, the surfaces flatten out to a slight extent. This elastic deformation is necessary in order to create adequate surface area to maintain an oil barrier between the element and race. The oil is trapped in the area between the flatted race and element and creates what is called an elastohydrodynamic (EHD) film.
The momentary flat spot created at the machine contact point is shown in Figure 2. Normal pressures in EHD contacts can reach 500,000 psi. At these pressures, the oil can become momentarily solid. A properly formed EHD oil pad is between 0.5 and 1.5 microns thick. As long as the dynamic viscosity is properly selected for the machine’s operating requirements (contact area, load, speed, temperature), then the machine’s components can remain separated and achieve long lifecycles.
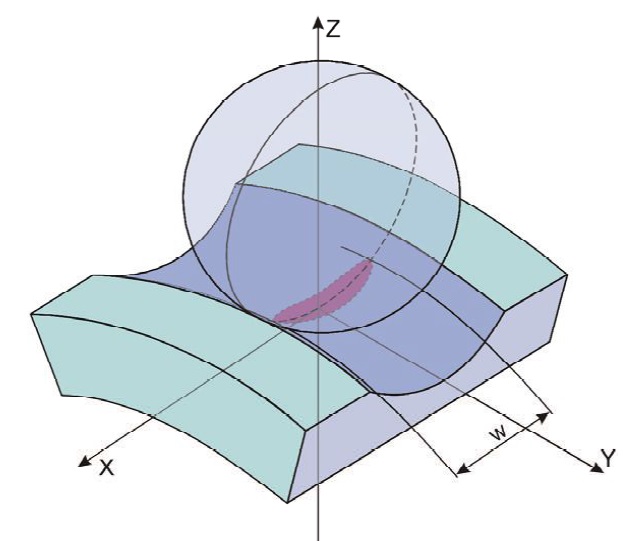 Figure 2. The area of surface deformation under normal load is shown in purple. (Courtesy of Lubcon GmBH)
As shown in Figure 3, when the oil film is ruptured and surface asperities from one surface contact asperities of the mating surface, then the impacts create a compression wave. The wave is transmitted throughout the component body. Given low asperity dimensional cross-sections and high rates of contact, the frequency of compression waves produced by the impact events is very high. When multiple asperities collide, the amount of energy produced rises dramatically, as shown in Figure 4. The expanding red lines represent the compression wave as it travels away from the impact location.
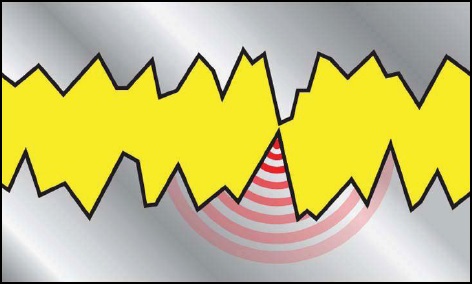 Figure 3. Asperity contact at the element surface creates high frequency energy pulses that can be measured and trended. (Courtesy of SPM Instruments)
Figure 4. Represents what is likely any time the oil film is lost, and the number of asperity contact events increases. (Courtesy of SPM Instruments)
Figure 5 further illustrates the concept of compression wave propagation using the impact of a steel ball on a steel surface. When the dropped ball impacts the steel plate, the initial moment of contact creates a compression wave that propagates through the plate. The impact energy is collected by a sensor and is (typically) reported in decibels (dBs), but can be presented in other formats as well (audible, visual, graphical). As the number of impacts producing stress waves increases, the decibel value also increases. Figure 6 illustrates the second phase of the impact event, which is cyclic movement of the surface in response to initial displacement from contact.
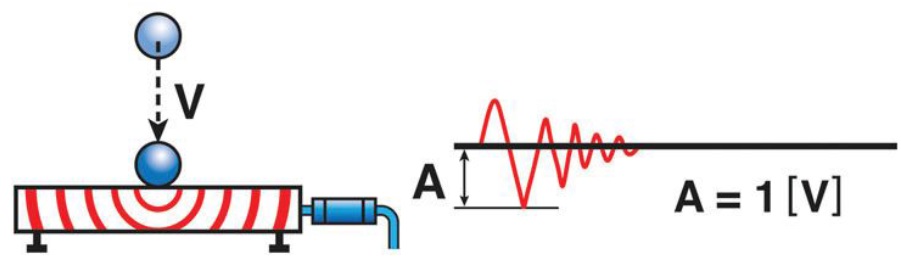 Figure 5. A compression wave is created by an impact event, which creates a high frequency energy wave. (Courtesy of SPM Instruments)
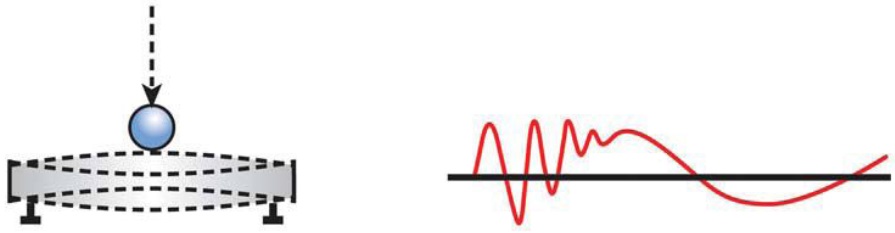
Figure 6. Following impact, movement from displacement creates a lower frequency energy wave. (Courtesy of SPM Instruments)
Vibration analysis sensors are used to track the movement cycles of the steel plate from the impact. Collecting the compression wave energy utilizes sensors tuned to the higher, sometimes specific, frequency. This data collection and analysis technique is known by several different names, including:
•
Spike Energy (Rockwell Automation (formerly IRD Mechanalysis))
•
Shock Pulse Monitoring (SPM, Inc.)
•
S.E.E. (Spectral Emitted Energy, by SKF)
•
Peak Energy (CSI)
•
Ultrasonic Energy (variety of airborne ultrasonic sensors manufacturers).
The energy produced by these contacts is known as ultrasonic energy. Sonic energy, which ranges between 20 Hz and 20 kHz, is detectible by humans without aid. Ultrasonic energy, at 20 kHz and above, is not. Ultrasound sensors used for industrial services (airborne, mechanical) can run well above 100 kHz.
There are many machine operating factors and considerations that influence the quality and usefulness of ultrasonic energy data, including but not limited to:
•
Bearing type.
•
Bearing size.
•
Bearing (shaft) speed.
•
Bearing load.
•
Bearing looseness.
•
The viscometric properties of the lubricant in the housing.
•
The volume of fresh lubricant in the housing.
•
The volume of lubricant spent (waxy residue) in the housing.
•
The mass of the bearing mount (housing).
•
The number of mechanical boundary layers the signal must penetrate.
•
Differences in metallurgy between each mechanical boundary from the point of ultrasound origin to the collection of the signal.
•
The angle of probe placement at the point of ultrasound energy collection.
•
Location of the sensor placement.
•
Length of zerk extension tube (for grease gun mounted sensors).
•
Length of stinger probes used to collect data.
As is the case with sampling from a reservoir, a clear understanding of how the energy is produced and how the energy should be collected should influence data collection techniques. This form of condition analysis, like oil analysis, is a garbage-in, garbage-out proposition.
DATA QUALITY & COLLECTION METHODS
There are several ultrasonic technology tool suppliers. Each has an interest in providing simplistic means to collect information to facilitate the sale of the instrument and to assist the user in taking maximum advantage of the instrument once it is in the technician’s hands.
Following are six options for sensor placement and data collection:
1.
Use a grease gun-equipped sensor for zerk mounting (not shown in Figure 7)
2.
Use a stinger or probe tip for manual contact
3.
Use a rail or 2-pole magnet mount
4.
Use a flat magnet mount
5.
Permanently attach the sensor with an adhesive mount
6.
Permanently attach the sensor with a fixed locking mount.
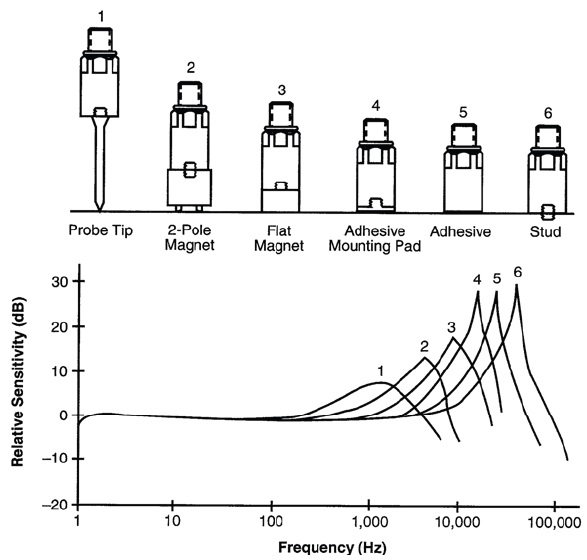 Figure 7. Six options for sensor mounting and the relative sensitivity of each. (Courtesy of Wilcoxin Research)
Each of these has drawbacks and benefits. Figure 7 shows six options for sensor attachment and comparison of the expected high frequency response for each. The option that provides the most secure and repeatable data collection is the stud-mount and locking sensor configuration (option 6). Each of the permanent mount options provides better sensitivity to the high frequency range than the more convenient, portable methods (probe and magnet mounts).
Figure 7 also shows the clear signal response advantages of stud-mounted data collection. Although it is a superior approach, the stud-mounted or even permanent adhesive mounting sensor configurations significantly increase the cost of measurement.
Accordingly, instrument providers are working to develop better ways to integrate data collection into the routine relubrication activity. Collection may be done directly through the grease gun (grease-fitting mounted sensor) or indirectly (bearing mounted sensor, grease gun mounted instrument), simultaneously addressing mounting cost issues and the practical issues of handheld collection.
The best comparison between the grease gun-mounted sensor and the six methods noted in the Wilcoxin example is the probe tip option, which is not an ideal approach, but is the most simplistic and readily deployable technique that is widely used. Ultrasonic energy program managers should be aware of the possibility of data loss inherent in their respective data collection techniques.
When sound travels through a medium, its intensity diminishes with distance. These influences can be described mathematically. Common interferences contributing to signal loss include:
1.
Poor collection methods (looseness between the grease gun and the zerk fitting). According to Figure 7, under similar conditions the difference between a contact-probe mounted and stud-mounted configurations can account for significant differences in decibel readings. This is due to the inherent and unavoidable looseness present in non-stud mount methods.
2.
Irregularities in bearing housing materials. Imperfections in the cast-iron housing materials from initial construction or from wear and tear over time can cause signal degradation.
3.
Reflectance and refraction. These are a function of the surface angles and number of mechanical interfaces that the energy waves encounter. Whenever sound waves encounter a boundary, a part of the wave is reflected and part is refracted. When a sound wave is reflected, a portion of the wave returns at an angle equal to the contact angle. The rest enters the new medium and is refracted.
When sound energy hits the boundary between surfaces at an angle, the wave changes direction due to the contact angle. Part of the wave enters the new medium first and changes speed, which causes the wave to bend. As the angle from the energy wave to the barrier decreases, the angle of refraction also gets closer to the barrier.
Signal refraction is described by Snell’s law, as seen in the following formula:
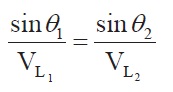
Where,
V
L1 is the longitudinal wave velocity in material 1.
V
L2 is the longitudinal wave velocity in material 2.
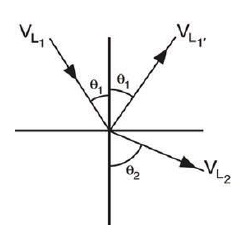
When the wave’s entering angle (θ
1) increases beyond a certain point, the refraction energy runs is parallel to the dividing line between the mediums. This is called the critical angle. The critical angle depends on the two transmission mediums. Because the velocity is different for every medium, even if the sound hits at the same angle, the angle of refraction will vary between mediums. The greater the difference in velocity between the two mediums, the greater the critical angle will be (
1).
If sound hits the new medium with any angle greater than the critical angle, it will not be able to enter. Assuming that there are no boundaries between the sensor and the emitting object, the mediums are the same (stainless steel-to-stainless steel, cast iron-to- cast iron, etc.) and the sensor is flush with the surface and perpendicular to the emitting source, the sound wave will pass through the emitting source and into the contact face of the sensor with little change in signal intensity or direction.
4.
Differences in metallurgy at any interface points between the point of signal generation and signal collection (acoustical impedance). Differences in the types of metals through which the signal must pass also negatively influence signal strength. Ultrasonic energy is either reflected or transmitted at mechanical interfaces. The amount of energy loss is dependent on differences between construction and data collection materials and their respective abilities to transmit sound. This is referred to as acoustical impedance and is analogous to electrical impedance (
2).
Sound travels through materials under the influence of sound pressure. Because molecules or atoms of a solid are bound elastically to one another, the excess pressure results in a wave propagating through the solid. The acoustic impedance (Z) of a material is defined as the product of its density (p) and acoustic velocity (V) (
3).
Z = pV, where
p = density in grams per cubic centimeter (g/cm
3)
V = longitudinal velocity in centimeters per microsecond (cm/µs)
Following are three ways in which acoustic impedance is important:
1.
The determination of acoustic transmission and reflection at the boundary of two materials having different acoustic impedances.
2.
The design of ultrasonic transducers.
3.
Assessing absorption of sound in a medium.
The values of the reflected and transmitted energy are the fractional amounts of the total energy incident on the interface (
4). These numbers must equal one. It is possible to calculate adsorption and reflectance for two materials if the material’s density (p) and acoustic velocity (V) (aka acoustic impedance) are known using the following formula:
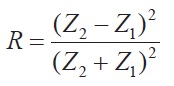
R = Reflection Coefficient
Z
1 = Acoustic Impedance of Medium 1
Z
2 = Acoustic Impedance of Medium 2
The transmission coefficient is 1 - R.
The acoustic impedance of common machine and component construction materials are provided in Figure 8.
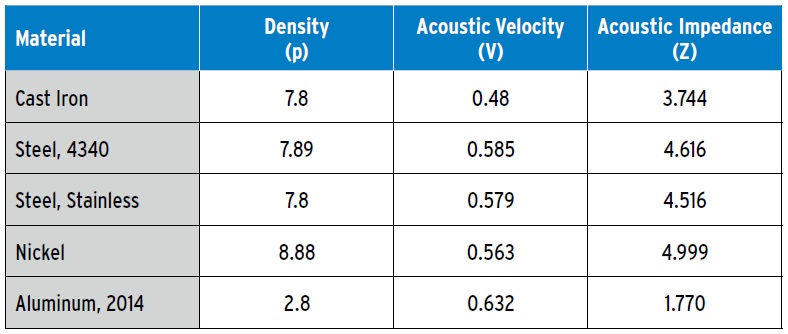 Figure 8. Common materials and their acoustic impedance values
One can see from performing the calculation that differences in acoustic impedance between materials (stainless bearing outer ring to cast-iron housing to stainless or aluminum probe or aluminum sensor base or stainless base) will degrade the quality of the signal. Unless the materials are the same from the frictional contact point to the collection electronics, one can assume signal loss, with the degree of lost transmittance dependant on the differences in material.
With the wide variety of potential ways to disturb the data, it becomes obvious that the collection technique and collection consistency are both key factors for quality acoustic analysis. It is essential that the technician use the best possible practices to minimize variability (flat, paint-free, perpendicular to the load zone, similar metals) and deliver exacting repeatability.
SUMMARY
High-frequency energy is produced when the naturally occurring asperities at two interacting surfaces collide under force. The impact creates a compression wave that propagates through the machine. There are different names for this energy medium, but in the end each represent a way to look at high-frequency energy production. As the number of asperity contacts increase (which coincides with the progressive loss of the oil film) the amount of measurable energy increases.
There is a variety of interferences common to ultrasonic frequency collection, including material defects, differences in impedance and reflection/ refraction. With fundamentally sound data collection techniques that deliver dependable, repeatable data, reliability engineers can systematically measure for lubricant film formation or loss of lubricant films in some critical machines.
REFERENCES
1.
Murphy, T.J. and Reinstra, A.A. (2010),
Hear More: A Guide to using Ultrasound for Leak Detection and Condition Monitoring,
reliabilityweb.com.
2.
ibid.
3.
Center for Non Destructive Testing: (
here)
4.
ibid.
 Mike Johnson, CLS, CMRP, MLT II, MLA III, is the principal consultant for Advanced Machine Reliability Resources, in Franklin, Tenn. You can reach him at mike.johnson@precisionlubrication.com
.