Managing sump condition control
Mike Johnson, Contributing Editor | TLT Best Practices July 2011
Five testing techniques can help manage contamination threats to your machine.
KEY CONCEPTS
•
Air, water, particulate and heat each represent a destructive threat. When they occur simultaneously, the threat is dramatically increased.
•
Lubricant-based testing gives the reliability engineer the best possible information about the nature of the sump contamination threat.
•
Onsite testing using a combination of simple tools and instruments can provide the user with adequate information to take corrective actions.
In the September 2009 issue of TLT, we asserted that contamination control of machine sumps is a vital requirement to preserve machine function and component health for all mechanical systems (
Editor’s note: digital edition available at
www.stle.org). However, it is important that we take another look at this issue from a condition monitoring perspective.
Contaminants enter lubrication sumps and initiate a variety of destructive chemical and physical reactions and interactions. The immediate contaminant and its inevitable collection of changes can cause both direct and indirect harm to the machine and lubricant. Without corrective action, lubrication effectiveness and machine health is lost.
In addition, a contaminant is defined as any material or energy that constitutes a chemically reactive hazard or that mechanically impairs the proper functioning of the equipment and the performance of the system (
1). In Part IV of this five-part series, we will focus on in-house and laboratory-based test methods used for identifying the common offenders: air, water, airborne dust and machine-generated wear debris.
MEASURING FOR AIR POLLUTION
Oxidation starts with oxygen, which starts with air contamination. Following initial chemical reactions involving oxygen, oxidation morphs into a variety of chemical reactions, which collectively destroy the lubricant.
Air may exist in any one of three different states within a tribosystem:
•
Dissolved
•
Entrained (small and large bubbles)
•
Free
Dissolved air is present in stable and low percentages in new, healthy lubricating oils, which is both understood and accepted. Under normal operating conditions (fluid churning, change in lubricant chemical properties, systems operating under pressure) the amount of dissolved air increases, can form stable bubbles in the body of the oil or stable foam on the surface of the fluid. Both conditions are a problem, but both are evident with sample collection and visual inspection.
Particularly for hydraulic and circulation systems, the amount of dissolved air increases linearly as system pressure increases. Pressurized systems contain increasing amounts of dissolved air as the pressure increases. As the highly aerated fluid experiences pressure drop on the pump inlet, this dissolved air can form bubbles and cause cavitation and damage in a variety of ways. Unfortunately, one cannot simply observe increased amounts of dissolved air in the fluid.
For high-priority circulation and hydraulic systems, samples should frequently (weekly to monthly) be collected and tested for elevated concentrations of dissolved air. A few shop-floor devices are available for this purpose, including this low-cost Squeezer DualAir™ by PAPEC, as shown in Figure 1. This device enables the user to quantify air by volume in a fluid system. A sample is collected and placed in the instrument and air is measured and compared to concentrations in the new fluid. If the percentage is determined to be too high (>10% total = caution, >20% = alert, >40% total = critical) then vacuum distillation can be used to return the fluid to its original state.
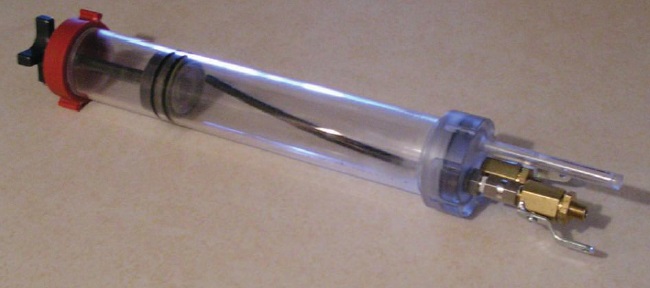 Figure 1. The Squeezer DualAir™ is used to test lubricant for excessive air contamination (2). (Courtesy of PAPEC)
Since it is impossible to prevent air to- oil contact, it is necessary to test for and equip machines with the means to tolerate the presence of air and other gases and to condition the fluid as needed based on testing. The product shown in Figure 2 passes the contaminated oil across a membrane that removes air and other gases based on molecule size and holds promise to remove air from lubricating sumps. Also, machine sump design should favor options to enhance air release as quickly as possible. The
June and
August 2010 issues of TLT addressed a variety of sump considerations (available digitally at
www.stle.org).
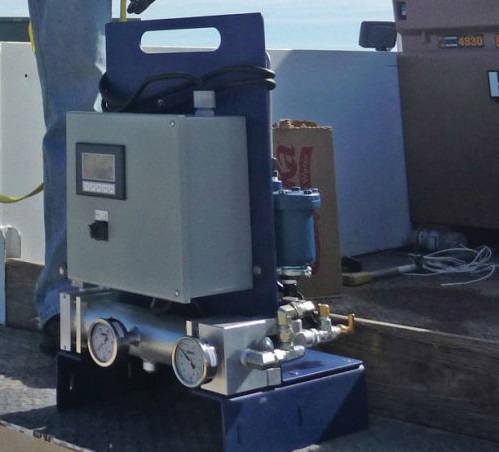 Figure 2. An innovative membrane technology designed to assist in moisture control. (Courtesy of Compact Membrane Systems, Inc.)
MOISTURE MEASUREMENT
Figure 2. An innovative membrane technology designed to assist in moisture control. (Courtesy of Compact Membrane Systems, Inc.)
MOISTURE MEASUREMENT
Most lubricants are based on materials that don’t easily combine with water. Mineral oil and PAO base stocks are nonpolar. These two categories account for the majority of industrial lubricants. However, many of the additives used with these fluids to create finished lubricants are polar and do have the capacity to attract water to the lubricant. Additionally, many common industrial chemicals (process chemicals, water treatment chemicals, soap, other lubricants) have the ability to change the surface tension characteristic of the lubricant, which will, in turn, increase its tendency to hold water.
Like oxygen, moisture is a prevalent contaminant. Much of the water contamination problem is introduced to the lubricant by contact with humid air. As humidity in the air increases, water concentrations in the lubricant also increase. Once in the oil, water may exist as either dissolved (individual molecules), emulsified (microscopic drops) or free forms. Temperature has an influence on the lubricant’s tendency to soak up water. As the temperature increases, the lubricant can sustain more water; conversely as the temperature decreases water solubility decreases.
Emulsified or entrained water is seriously damaging to both lubricant and machine load-bearing surfaces. Fortunately, it is obvious and plant personnel are already tuned to observe oil in/on level indicators for any evidence of cloudy conditions. Dissolved water is impossible to detect visually, and free water is difficult to detect in a sump because one cannot easily look through the oil to the bottom of the reservoir.
Lubricant analysis for moisture control begins with visual observation, but this is only useful to detect high concentrations of water. Given that, per bearing manufacturers, roughly half of bearing life cycle potential is lost by the time the lubricant achieves only 500 ppm (.05%). It is important to have a method to detect concentrations below the lubricant’s cloud point. This will differ between lubricants, depending on their base stock and additive type and concentration.
Moisture analysis can be done on site well enough to make follow-on decisions for work to be done, beginning with highly subjective on site tests to quantitative lab-based analysis.
Following are five types of tests, two of which are qualitative. The other three involve instruments, are quantitative and should be conducted at the plant site.
Level 1: Crackle Testing. This fully qualitative/subjective approach requires little more than motivation to conduct. A best-case approach would require the use of a laboratory or kitchen hotplate turned up to 350 F. A few milliliters of oil dropped on the hot surface will respond turbulently, depending on the amount of water. As shown in Figure 3, water boils off of the lubricant, changing phase and either bubbling (very low concentration) or popping (high concentration) upon contact with the hot surface.
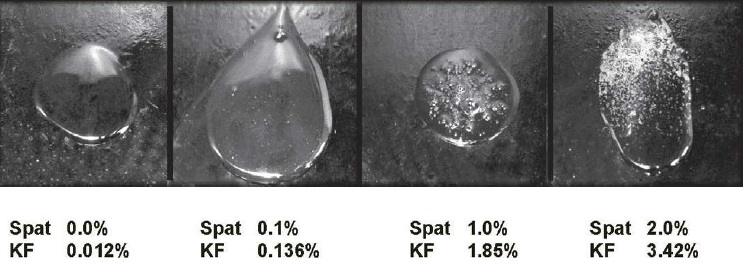 Figure 3. Karl Fischer (KF) laboratory-based result compared to a subjective crackle test. (Courtesy of Condition Monitoring International)
Even on the low end of the scale (≤500 ppm), there can be enough water to harm the machines. Crackle indicates gross contamination and a strong positive certainly is enough to know to condition the fluid with a dehydrator but is not strong enough to reliably identify low concentrations. Therefore, another technique is needed to identify low concentrations.
Level 2: Calcium Hydride Testing. A qualified estimate is provided by the use of calcium-hydride type testers. A few companies provide test cell packs that enable the user to qualify down to a level of a couple hundred ppm. The technique involves mixing of a sample with a reagent to initiate a chemical reaction in the test cell. The greater the amount of moisture, the greater gas pressure is produced, which correlates to moisture level. This technique does not provide for exacting trending of results over time but does enable quick decision-making in response to rising moisture.
Level 3: Onsite Electronic Sensors. This growing field includes sensors developed by several manufacturers. The sensors represent a combination of continuous (online) and intermittent (sample bottle) testing for moisture. The results are provided in a variety of units. Water in parts per million (ppm) is widely recognized and is likely the most comfortable unit for machine operators to work with, but other options exist. These sensors have varying levels of sensitivity but are collectively useful as a low-cost replacement to the subjective options noted above.
Level 4: Offsite FTIR Scan. Many labs provide Fourier Transfer Infrared Spectroscopy (FTIR) scans routinely to evaluate multiple parameters. One of those parameters is moisture/water. FTIR indicates presence of moisture by recognition of hydrogen bonding to water between 3,000 cm–3,700 cm.
-1 Water is measured indirectly and doesn’t provide an actual concentration, but it does provide impetus to proceed automatically with a hard count. The FTIR provides multiple benefits that justify its routine use beyond water measurement. This should be a default test for all test slates, alongside traditional wear metals analysis.
Level 5: Offsite Karl Fischer. This gold standard for water concentration measurement is well known and widely used. If a company wishes to engage in systematic improvements to suppress water contamination in machines, then quantitative analysis via KF is warranted. There are different KF techniques that can be selected depending on the type of lubricants being analyzed (ASTM D1744 and D6304), both of which report accurately to the low double digits.
Filter manufacturers have devised a variety of moisture-removal systems around these physical response characteristics. One of the most effective methods to drive water off is the vacuum dehydration filter method. The lubricant is pumped into a vacuum chamber where the pressure is decreased (25" Hg) and the temperature is raised to a level that will allow water to boil (133 F/56 C) at a low temperature. Other removal methods include absorbent media (low-volume, low-efficiency), centrifugal separation (high volume, moderate-efficiency) and thermal dehydration (high-volume, high-efficiency).
The use of membrane separation techniques are also attractive options. Figure 4 shows a membrane separation technique predicated upon super dry air passed across the lubricant’s head space. The Stealth dehydrator, provided by Fluitec International, feeds low-pressure super-dehydrated air (dew point at -40 C) into the reservoir head space. The moisture from the oil is drawn into the super-dry air and is decanted continuously until moisture levels are very low. Additionally, the device noted in Figure 2 is designed to remove moisture in an approach similar to its removal of air. This dual-purpose function has added benefits.
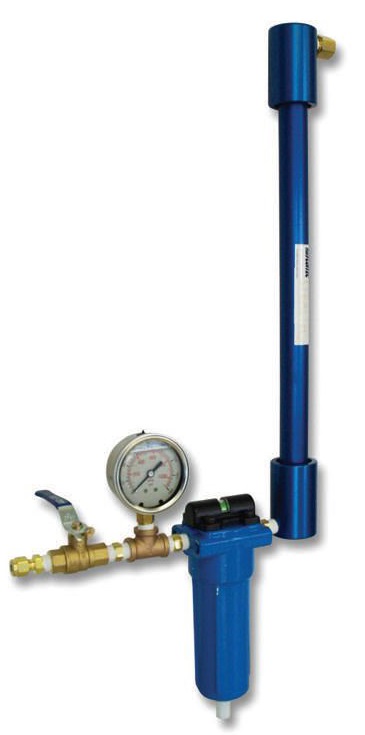 Figure 4. The StealthEHC system is designed to remove moisture from contaminated oil. (Courtesy of Fluitec International)
PARTICULATE MEASUREMENT
Figure 4. The StealthEHC system is designed to remove moisture from contaminated oil. (Courtesy of Fluitec International)
PARTICULATE MEASUREMENT
Solid particles are very common, represent a strong threat to the component surfaces and control mechanisms in all types of lubricated production machines. Some of the airborne dust particulate that can migrate into lubrication systems are harder than the machine metals used in machine construction. Microscopic particles promote micropitting, fatigue and three-body wear in proportion to density, hardness and toughness (friability), shape and their concentration in the oil. This is a difficult machine care problem.
There are several different ways to measure a contaminant concentration, including patch inspections, distribution and size estimates, centrifugal aggregation measurement and gravimetric measurement. This section focuses on visual observation and density analysis methods. Beginning with shop tools and on-the-floor analysis, the use of patch testing is a maligned but viable starting point.
Patch Testing. The use of patch test based review and correction is not unlike the use of quantitative particle counting techniques. However, instead of assigning a caution and critical limit based on ISO grade, the limit is based on the patch result. For instance, the Millipore kit provides a tint-comparator that the analyst uses to grade the patch based on different shade-grades (1-6). There is a brown scale and a gray scale for different oil types. The reliability engineer could begin his methodical improvement process with a low-cost patch generator and assign grades according to machine criticality and function.
For instance, for a gearbox, the acceptable score could be a 3, where with a low-criticality hydraulic system it would be a 2, and for a high-criticality hydraulic or turbine system it would be a 1. Following the patch generation, a decision can be made to filter the oil where needed. Although subjective, this approach is viable.
Figure 5 gives a loose correlation between a patch test and a particle count.
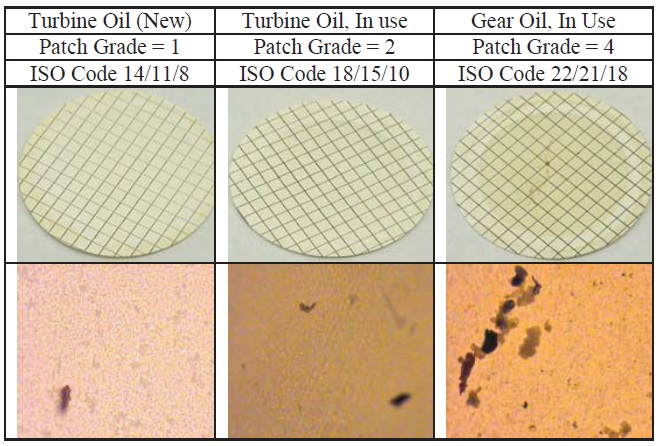 Figure 5. Patch testing and particle count results shown side-by-side (Courtesy of MRG Labs)
Automatic Particle Counters.
Figure 5. Patch testing and particle count results shown side-by-side (Courtesy of MRG Labs)
Automatic Particle Counters. There are several manufacturers of particle counters that make units for both in plant and laboratory-based use. Most use the ISO 11171 instrument calibration and reporting method and accordingly report in units of particles per milliliter based on concentrations of 4, 6 and 14 micron-sized particles. Although these are not commonly reported, additional units include concentrations of 21, 38 and 70 micron-sized particles. All concentrations are reported per milliliter. In the
May TLT, we provided insight into using wear debris analysis to examine changes in machine health (available digitally at
www.stle.org).
Site-based particle counting is done using a probe from using a probe from the instrument select fluid directly from the machine Bypassing the sample collection step or using a sample bottle on a desktop. Probe-on options are subject to interference from entrained air and water passing through the machine and bottle-based sample options are subject to interference from the sample collection process. Techniques are recommended by instrument suppliers for overcoming these problems. Both filter element and instrument suppliers offer thresholds to consider for different machine types, criticality and operating conditions.
For instance, as shown in Figure 6, Schroeder Filter Co. Provides suggested cleanliness levels to assure maximum component effectiveness based on component type and operating state.
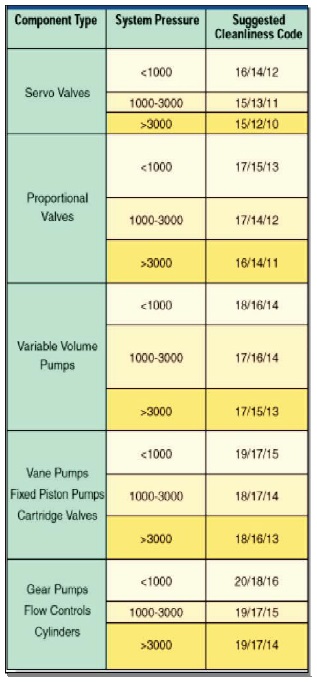 Figure 6. Suggested ISO cleanliness values to assure system performance. (Courtesy of Schroeder Filter Co.)
Automated Electron Beam with Automated Particle Feature Particle Analysis.
Figure 6. Suggested ISO cleanliness values to assure system performance. (Courtesy of Schroeder Filter Co.)
Automated Electron Beam with Automated Particle Feature Particle Analysis. A recent enhancement to longstanding laboratory-based test includes the use of an electron beam to scan a portion of the surface area of a sample passed through a patch, measure particles by size and shape, diagnose the material content and log the results as a combination particle count, morphological profile and elemental analysis.
This approach is a step forward from the traditional approach of using scanning electron microscopy to evaluate elements of particulate found on a sample. By adding feature analysis software and automating the use of the electron beam to focus randomly selected cross-sections of a prepared patch, this new technique enables the laboratory to diagnose the particle concentration, provide a particle count and a characterization of the wear mode based on particle morphology. It also provides a spectrometric profile of the scanned particles through an x-ray spectrometer integrated into the electron- imaging beam.
Although the test is time-consuming vs. a traditional particle count, it provides considerably more information than traditional methods, which is most useful when diagnosing systematic problems within a machine sump (
3).
After it is determined that the concentration of debris in the oil is beyond a recognized limit, filtration can be applied to correct the condition. Filtration product suppliers are able and willing to provide thorough technical support to offer improvements.
SUMMARY
Contaminant monitoring and control is of paramount importance to machine productivity. Air, water and particulate (atmospheric and wear related) are dominant contamination threats to industrial machines. Using techniques that clearly diagnose each threat and setting specific responses to each exception is at the heart of defect elimination and condition improvement for industrial machines.
It is useful to drive these diagnoses to the shop floor and assign condition monitoring technicians the task to use available technologies to make quick and dependable decisions. There are many options to choose from covering all three points of interest. Laboratory testing is typically more quantitative, takes longer and provides for stronger long-term trending of data for pattern diagnosis. At a minimum, lab-based analysis done following recorded exceptions from shop floor analysis is essential to a healthy program.
REFERENCES
1.
Fitch, E.C. “Proactive Maintenance for Mechanical Systems,” 2nd Edition, ©FES, Inc., p. 19.
2.
PAPEC. Click
here.
3.
Herguth, W., “Particle Counting, Sizing and Characterization in Wind Turbine Gearbox Lubricants Utilizing Scanning Electron Microscopy (SEM) with Automated Electron Beam and Automated Feature Analysis (AFA) Software,”
Presented at the STLE 2011 Annual Meeting & Exhibition, May 15-19, Atlanta, Ga. (USA).
 Mike Johnson, CLS, CMRP, MLT II, MLA III, is the principal consultant for Advanced Machine Reliability Resources, in Franklin, Tenn. You can reach him at mike.johnson@precisionlubrication.com
.