Selecting an oil analysis laboratory
Mike Johnson | TLT Best Practices December 2010
Evaluate technical and quality issues before choosing a supplier.

www.canstockphoto.com
KEY CONCEPTS
•
Sample price should not be considered until technical and laboratory quality issues are satisfactorily evaluated.
•
Testing capability and instrument accuracy are at the heart of oil analysis data.
•
Web-based communications have markedly facilitated the delivery of sample results and are highly recommended.
Selecting an oil analysis supplier requires a thoughtful exercise in laboratory quality evaluation. There are many factors to consider when selecting a lab, but if you set your goals and requirements in advance, the number of qualifying labs will be reduced.
Vendor selections often devolve into a price-clubbing activity, which is a no-win situation because all of the potential vendors and end-users eventually lose out. Though sample price isn’t irrelevant, it shouldn’t be considered until all technical and quality issues are thoroughly evaluated and ranked according to the needs of the end-user.
Best practices means evaluating these four important laboratory quality issues:
1.
Logistics
2.
Testing capability and accuracy
3.
Interpretation quality
4.
Information management
Once these bases are covered, pricing becomes a legitimate point of consideration.
LOGISTICS
Processing individual samples through a multistation lab environment without losing track of each sample bottle and its corresponding results requires thoughtful planning and rigorous attention to details.
Sample tracking. The use of barcoding helps maintain tight control over sample bottle location and test sequence. Some labs offer preprinted labels that include a barcode identifying the customer, the machine (component) and tests to be conducted. There are times when a customer sends a box of poorly marked sample bottles and requests they be processed. In this situation it is reasonable to ask why and maybe consider refusing their request. There should be a system for labeling and tracking even poorly identified samples through the instrument stations in order to intercept and resolve any outstanding issues with the samples.
Turnaround cycle. In my early years in the industry, I worked with a high-quality in-house lab. The lab did exceptional work, going to significant lengths to accurately determine the real causes of change. The lab also took a long time to turn the results around. There should be balance between timeliness and quality. Labs with highly standardized practices will have better quality and efficiency (whether the practices are correct or not is a different question). Your lab should have a strong track record for a 24-48-hour turnaround time. Some labs allow you to track that process remotely.
Sample retention time. Following provision of the results, users typically take several hours or days to fully review all the data and comments. It is common to decide that additional tests should be conducted to create more detailed data. Labs retain samples as a policy for a period of time for this reason. Sample retention cycles and a storage and indexing system is important. A 30-day sample retention interval should provide enough time for the user to review data and request additional tests or rechecks if results are unusual. The lab should have the means to spot such situations prior to accepting and forwarding the data to the customer.
CAPABILITY AND ACCURACY
Ask two important questions: (1.) Can the lab perform the required tests and (2). How good a job does the lab do performing these tests?
There are several tests that measure oil and machine health, some overlapping. Nearly all of these tests were developed to measure new oil properties and capabilities but work well to grade used oil and machine health when adapted accordingly-and with the adaption causing no significant effect on data efficacy. Tests such as wear metals are highly specific to machine-condition assessment. Any of the common wear debris analysis tests-PQ, Direct Read Ferrography, Analytical Ferrography, Ferrous Particle Count, Patch Analysis-qualifies.
There are as many as 20 common tests that could be used as a nucleus for creating a used-oil lab technical offering. These tests measure viscosity, chemical constituency, chemical stability, oxidation stability, contaminants, (fuel, glycol, solids, residue, moisture) and wear debris. Each of the test instruments has to be operated in a systematic and repeatable manner to assure quality results, including calibration and instrument repeatability.
The Joint Oil Analysis Program was developed by the military for conducting aviation and non-aviation machine and oil analysis. There are a series of documents available that spell out the expectations for their oil analysis programs such as sampling, data interpretation and reporting. The document identification numbers used by the U.S. Army are TM 38-301-1,-2,-3 and -4. Each represents a portion of the instruction set that illustrates why the program exists, what tests are to be run, how instrument management is to be performed and how the data is to be evaluated. A Google search using these numbers provides an extensive library of information. It is free of charge and could help you make decisions in choosing a testing strategy.
Regardless of a lab’s test methods, there should be a process it uses to manage instrument operation. ISO/IEC 17025:2005, available through ANSI, was developed as a guideline for labs to use in developing their management systems for quality and technical operations. As an independent standard that qualifies competence, it also is used to grade competence.
 INTERPRETATION QUALITY
Turning data into information may be the single biggest challenge the used-oil lab faces. Reported results may be used differently by different users depending on the user’s capabilities. Often a user receives a report and quickly scans the page looking for a red X or a green ✓, irrespective of what the data actually represents. If users are not technically strong or qualified, the lab report should offer more than simple anecdotal commentary about limits being exceeded.
For example, if a wear debris report clearly reflects an increase in iron, chromium, tin and lead simultaneously, then the lab might suggest diagnostics to search for bearing failure, perhaps even suggesting cage-specific investigation instead of simply noting increased wear and assigning an alarm value. However, in order to provide a more detailed level of recommendation, the lab must know the context from which the sample was collected and have personnel experienced in evaluating data from the machinery under test. One should ask the lab: What are your personnel’s qualifications to evaluate, what similar accounts do you serve, and would you please furnish a reference or two?
In order to create an accurate sample context, the lab needs to understand the component’s mechanical function, operating context (paper mill, steel mill, cement plant) and operating conditions. This includes machine criticality, previous oil analysis history, oil age, amount of top-up, quality of any filtration, extent of filtration, etc.
These essential pieces of the evaluation puzzle should be clearly defined before the first sample is taken and the criteria is assembled into a profile for the machine. Here one should investigate the lab’s ability to fully profile a component in terms of all necessary parameters: component type (screw compressor, gas turbine, etc.), manufacturer, model, application, lube manufacturer, lube brand and grade.
Ideally all these parameters are in separate fields so they can be differentiated for evaluation purposes. This is important for a variety of alarm levels, which should be considered based on component differentiation. The most recent sample, along with the machine’s sample history, should be processed through the profile to assign alarms to each data point. As was previously discussed, alarms can be statistical, percentage, absolute value or combinations of same, including an assessment of severity.
This massaging of the data for each machine provides the analyst with a qualified view of change or constancy in the machine’s operating state. Obviously, if the lab is intent on providing detailed and accurate analysis, it must ask for this information and have a system to manage the variables requested.
After the generated data has been qualified and labeled according to its respective state of alarm, the analyst’s depth of perspective is needed to make a final assessment and render rational comments. Obviously, the knowledge and experience level of the analyst is influential on the quality of the rendered opinion. In this instance, simple experience in the lab environment does not necessarily commute to useful judgment calls.
Qualifying the lab for the quality of its rendered judgments is particularly hard to measure, requiring large amounts of experience and perspective by the evaluator. Nevertheless this critical aspect should not go unexplored before committing one’s program. If the lab seems to meet all but this requirement, the notion of an independent evaluator may have strong merit.
The lab should be able to demonstrate the means to collect and characterize many points of interest (the context) about each sample point and demonstrate how its data management systems incorporate the multifaceted details into assigning alarms to the data.
As previously noted, the lab also should demonstrate qualifications for its analysts and maybe even show how junior analysts are educated and trained to become senior analysts.
INFORMATION MANAGEMENT
The last piece of investigation into the lab’s work is reviewing how the lab manages information. In the end, the only piece of information the customer sees is the machine-specific report, whether in print or electronic format. However, that document is an extension of the lab’s fitness for managing an extraordinary amount of information, beginning with the information about the machines and the operating context.
Labs use software systems called Laboratory Information Management Systems (LIMS), which might be provided by independent software houses or an instrument supplier in conjunction with an instrument suite. Final reports can be printed and mailed, e-mailed or uploaded to a database where the user can log in and review data.
Aside from the questions about quality of the data and commentary, competition for quality and speed of delivery results is high in the age of Web-based communications.
Figure 1 shows an example of the nature of modern data reporting. This data management system provides the user with multiple filter options: component name and type, manufacturer name, brand name (if different from the manufacturer), oil name, etc. In addition, the initial screen provides an overview of the state of machine conditions (red, amber, yellow, green) by severity. The display also allows the user to sort by date the data was completed through a variety of other modes that can accelerate the evaluation by the end-user. This data is sorted by component type. Once in this type of display program, the data are/should be capable of selection and download for further analysis and charting purposes.
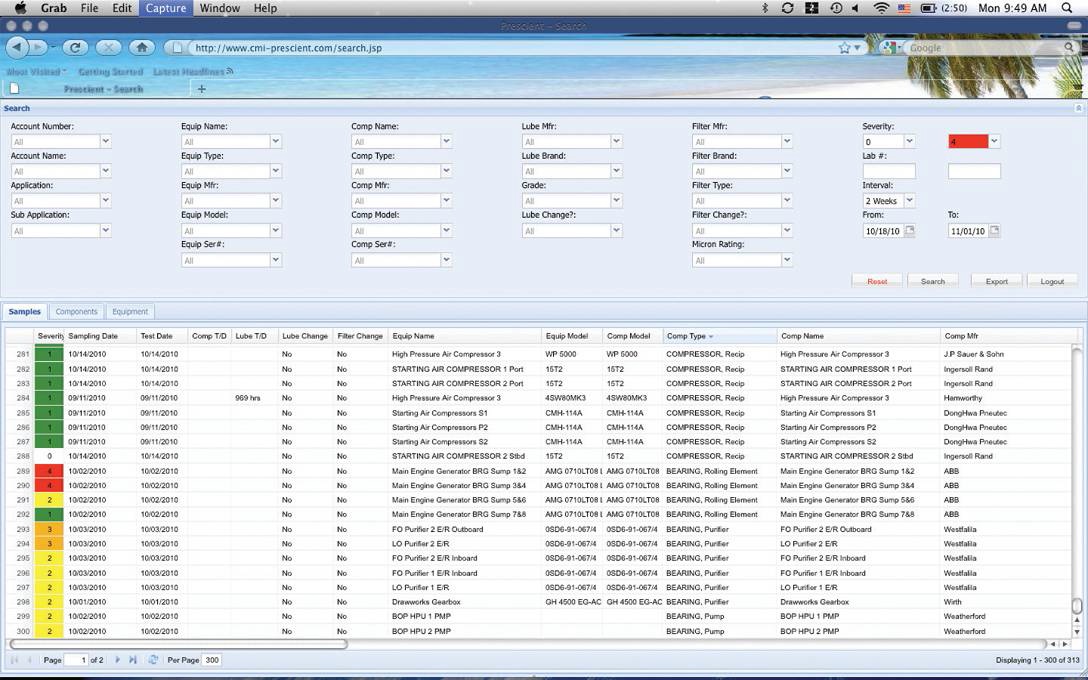 Figure 1. Prescient—Lubricant-Based, Web-Enabled Machine Diagnosis Program (Courtesy of Jack Poley, Condition Monitoring International)
SAMPLE COST
Figure 1. Prescient—Lubricant-Based, Web-Enabled Machine Diagnosis Program (Courtesy of Jack Poley, Condition Monitoring International)
SAMPLE COST
The cost of sample processing varies based on such factors as quality of the instruments, data management, processing methodology and experience of the analysts behind the reports. The last item should not be marginalized. Quality data generation and information management can be nullified by hasty or inexperienced analytical commentary.
Free oil analysis, provided with the use of the filter element or lubricant or as part of a machine service agreement, is not free. It’s built into the price of the services or products you purchase from that vendor. It behooves you to be sure there is valuable work being conducted by the provider and to be considerate of the contribution that the analysis reports make to assuring machine reliability. If the qualities stated above are lacking, it is possible that over the long haul the free analysis may cost much more than a fee-based service.
Prices for oil analysis services range between $15 and $60 per routine sample, but unless one understands what precisely is comprised-test slate, instrument set, calibration and accuracy, data accuracy, interpretation accuracy, reporting effectiveness, speed of the whole cycle-assessing the value properly is difficult.
SUMMARY
Oil analysis services provide a critical part of the condition-based maintenance puzzle. Sample tracking, turnaround and retention are important logistical concerns. Sample results and report quality are both influenced by the lab’s testing capabilities and effectiveness for managing its instruments. Instrument calibration and repeatability are keys to producing quality results.
Once the right tests are selected and accurate results produced, the lab must convert the data to practical, actionable reports. Analyst experience and depth of perspective about the operating context of each machine, sump and sample point is critical. Users must provide the lab with the needed and correct background details, and the lab must manage, track and incorporate these details into the final report. This requires a sophisticated information-management system and approach.
Generating and mailing paper reports is often the preferred method for some customers, but Web-based databases provide a far more powerful option for bringing data from the lab into a selectively reviewable format with all the necessary nuances so worthy of consideration in a complex environment.
 Mike Johnson, CLS, CMRP, MLTII, MLA1, is the principal consultant for Advanced Machine Reliability Resources, in Franklin, Tenn. You can reach him at mike.johnson@precisionlubrication.com
.