20 Minutes With Dr. Mark C. Malburg
Karl M. Phipps, Managing Editor | TLT 20 Minutes September 2010
This British-educated researcher develops analytical and measuring procedures for surface characterization.
MARK C. MALBURG PROFILE
PROFESSIONAL EXPERIENCE
•
Digital Metrology Solutions, Inc., Columbus, Ind., President, 1999-Present.
•
Verified Technologies, Inc., Columbus, Ind., Partner, 2008-Present.
•
University of North Carolina at Charlotte, Charlotte, N.C., Adjunct Assistant Professor of Mechanical Engineering, 2001-Present.
•
Cummins Engine Co., Columbus, Ind., 1989-1999
•
Technical Advisor – Metrology Development
Group Leader – Metrology Development
Senior Engineer – Surface Metrology
Engineer – Fuel Systems Metrology
•
Michigan Technological University, Houghton, Mich., Graduate Research Assistant, 1988-1989.
•
Michigan Technological University, Houghton, Mich., Graduate Teaching Assistant, 1988.
EDUCATION
•
University of Warwick, Coventry, United Kingdom, Doctorate in Engineering.
•
Michigan Technological University, Houghton, Mich., Master’s of Science in Mechanical Engineering.
•
Michigan Technological University, Houghton, Mich., Bachelor’s of Science in Mechanical Engineering.
PATENTS
•
Creator of the widely popular “OmniSurf” surface texture analysis software package.
•
Link, G. Sridhara, R., Hamidieh, Y. and Malburg, M., “Method for Analyzing Waviness of a Surface,” U.S. Patent 7,035,761.
•
McNaughton, R. and Malburg, M., “Method for Evaluating a Disc Brake Rotor,” U.S. Patent 7,437,917.
 Mark C. Malburg
TLT: Explain the importance of surface filtering—why is it needed in evaluating a hydrodynamic operation?
Malburg: First, we need to clear up a misconception. When we analyze surfaces we don't generally filter things out. We use filters to separate things. More specifically, we can separate long-, middle- and short-wavelength regimes, according to the user's needs.
When we apply this concept of using filters to separate wavelengths, we can better understand and control the various wavelength regimes. In most cases, engineers and researchers use filtering to obtain a roughness profile or roughness map and then tend to forget or ignore the longer wavelengths. This is unfortunate in that many surfaces exhibit higher amplitudes in the waviness and form domains than they do in the roughness domain. Figure 1 shows the height of the waviness and form as compared to the height of the roughness. Most instruments only provide two wavelength domains. However, it is often useful to separate the measured data into three or more domains.
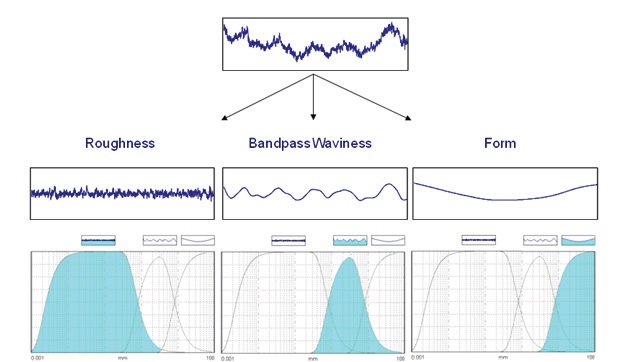 Figure 1. Using filters to separate a measured profile into three wavelength domains.
Surface filtering is very important in understanding hydrodynamic interfaces as the various wavelength domains affect the lubrication in different ways. Filtering is the basis for determining "roughness." Without filtering, we do not even have a roughness data set from which to perform calculations regarding asperity contact and lubrication.
TLT: How is filtering accomplished? What is the difference among RC, Gaussian and Robust Gaussian filters?
Malburg: Historically, measured traces were relatively short and just leveled as there was no concept of filtering. When people started making longer traces, they simply broke them into shorter pieces and leveled each piece. This caused a problem in that the resulting data was no longer continuous nor was there a concept of waviness.
As electronic-measuring instruments were introduced, analog filters such as the 2-Capacitor-Resistor or 2CR filter were employed to remove the underlying shape from the roughness. The circuit acted as a kind of "electronic smoothing," however, it introduced significant phase distortions regarding the shapes and locations of profile features.
Today we use digital filters to isolate and define all wavelength domains from roughness through form. The digital filtering process uses some form of moving average to separate long wavelengths from short wavelengths. The Gaussian filter uses a weighted moving average to obtain a waviness profile, whereby the weighting function is the shape of the Gaussian bell curve, as shown in Figure 2. The amount of smoothing is based on the width of the weighting function.
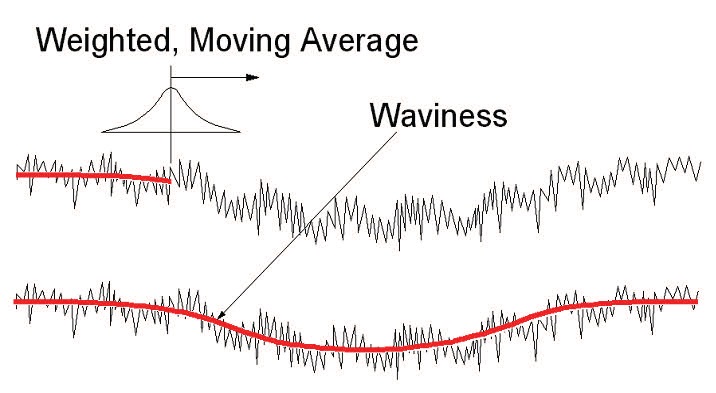 Figure 2. The Gaussian filter.
In most filtering implementations, the long wavelength (e.g., waviness) profile is determined and then subtracted from the original data set to obtain the short wavelength (e.g., roughness) profile. Roughness is mathematically defined as everything that is above and below the waviness profile.
The Gaussian filter is the ideal filter for surface texture analysis in that it provides the sharpest transmission characteristic (the sharpest separation between roughness and waviness) without inducing additional unwanted overshoots or Gibbs effects in the profile. In the context of control theory, the Gaussian filter can be thought of as critically damped. Mathematically and metrologically speaking, the Gaussian filter Is the ideal filter and is, therefore, recommended as the default filter in ASME and ISO standards (
1, 2).
However, the Gaussian filter does have one significant problem. It can cause significant distortions around extreme local features such as deep valleys or deep pores, as shown in Figure 3.
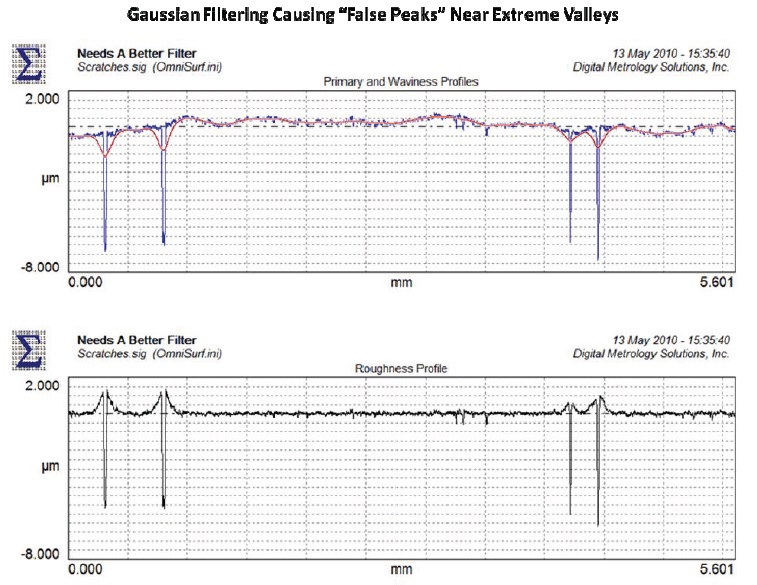 Figure 3. With the Gaussian filter, the waviness profile is pulled into deep valleys (see the red profile). This results in the creation of artificial roughness peaks on each side of the valley. (Source: click here)
When the Gaussian's moving average is in the proximity of a deep valley, the waviness profile is pulled downward. Since the sides of the original valley are now above the waviness profile, they become "false peaks" in the roughness profile. These false peaks often are misinterpreted as real, pushed up edges comprised of actual material.
In recent years, Robust filtering was introduced as part of the ISO 16610 family of standards and technical specifications This has been a very significant advancement in the filtering of surfaces. Robust filtering decreases the filter's weighting at these extreme points based on statistical methods. The resulting waviness profile is no longer affected by the extreme points, and the roughness profile does not exhibit false peaks (
See Figure 4).
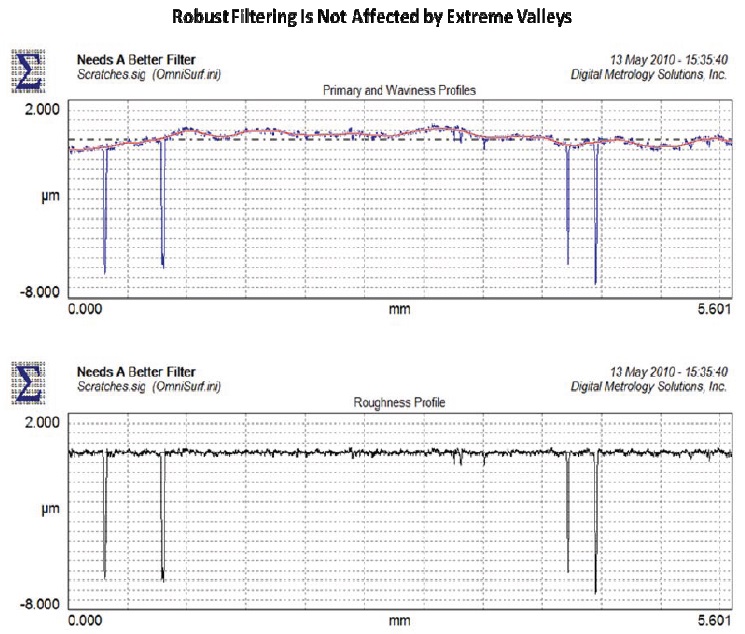 Figure 4. With the Robust filter, the waviness profile is not pulled into deep valleys as was the case with the Gaussian filter. This results in a true representation of waviness and roughness. (Source: click here).
TLT: What is the difference between roughness and waviness?
Figure 4. With the Robust filter, the waviness profile is not pulled into deep valleys as was the case with the Gaussian filter. This results in a true representation of waviness and roughness. (Source: click here).
TLT: What is the difference between roughness and waviness?
Malburg: In addition to the differences above, "roughness" in the most general of terms describes short wavelengths, and "waviness" describes longer wavelengths. However, if we really think about it, they both lack any scientific definition. For example, the moon is rough with craters and mountains. Sandpaper is rough based on the size of its grit. The moon has rough features that are miles apart, while roughness features of sandpaper may only be fractions of a millimeter apart. Unfortunately, these conditions are both referred to as "roughness."
In order to properly define roughness or waviness in scientific terms, we must include a description of the wavelength domain that we are referring to. A typical roughness domain has a range of wavelengths between 2.5 micrometers and 0.8 millimeters. This range of wavelengths is said to have a 300:1 bandwidth, as the long wavelength limit is approximately 300 times greater than the short wavelength limit. These wavelength limits are referred to as the filter cutoff wavelengths, and they are selectable by the user. In fact, they should be selected carefully by the user as they can have a huge influence on the calculated parameter results.
TLT: What errors may result from improper filtering?
Malburg: The biggest error that people make regarding filtering is the error of neglecting one wavelength regime. Most surface specifications only address "roughness." Unfortunately, the more important feature, waviness, is often ignored. The profile graph shown in Figure 1 is from a real surface, and the waviness height is much more significant than that of the roughness.
Another filtering problem arises when the filter cutoff wavelength does not properly fit the shape of the surface or the intended function of the surface. In some cases, the filter cutoff is too short and some of the roughness details appear in the waviness profile. In other cases, the filter cutoff is too long and some of the waviness features are present in the roughness profile.
In this example, as shown in Figure 5, the selected roughness cutoff wavelength is too large. We see that the red waviness profile does not follow all of the waviness shapes in the primary (blue) profile. As a result, there are waviness features present in the roughness profile.
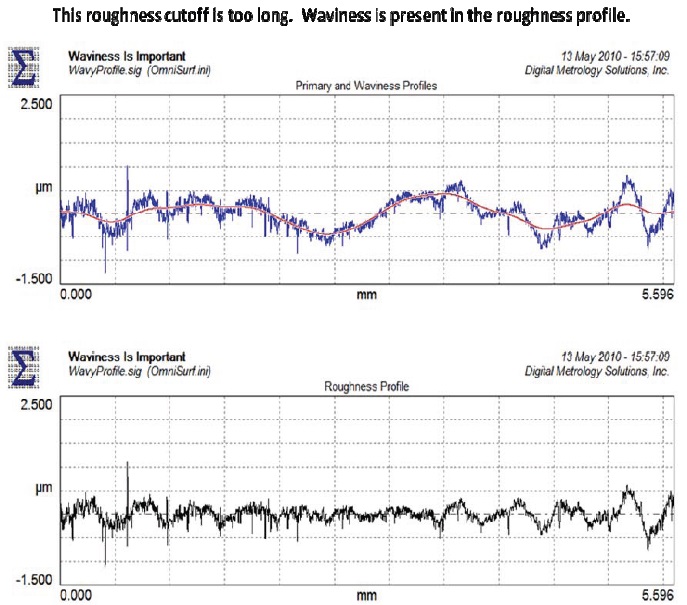 Figure 5. This filter cutoff value is too large for these waviness features. The roughness values will be artificially high due to the influence of waviness.
If we choose a shorter roughness cutoff wavelength, we see that the red waviness profile does a better job of following the long wavelength features in the primary profile. As a result, the roughness profile contains only the short wavelength features (
See Figure 6).
 Figure 6. This filter cutoff value properly distinguishes these waviness features.
Similarly, we can have a problem in selecting a roughness cutoff that is too short. In the case of a shorter roughness cutoff, the reported roughness values will be artificially low as not enough long wavelength content is contained in the roughness profile.
TLT: Explain the transmission characteristics of filters as they are shown in the ASME B46.1-2002 standard on surface texture.
Malburg: Filter transmission characteristics provide a representation of which wavelengths are included and which are suppressed in a given domain. The Gaussian filter provides the sharpest filter transmission curve. The typical roughness domain is described by the transmission functions of two Gaussian filters (
See Figure 7). One filter suppresses the shortest wavelengths, while the other suppresses the longest wavelengths. Different filter types such as the obsolete 2CR filter have different shapes for these curves; however, today we use the ideal Gaussian transmission characteristic.
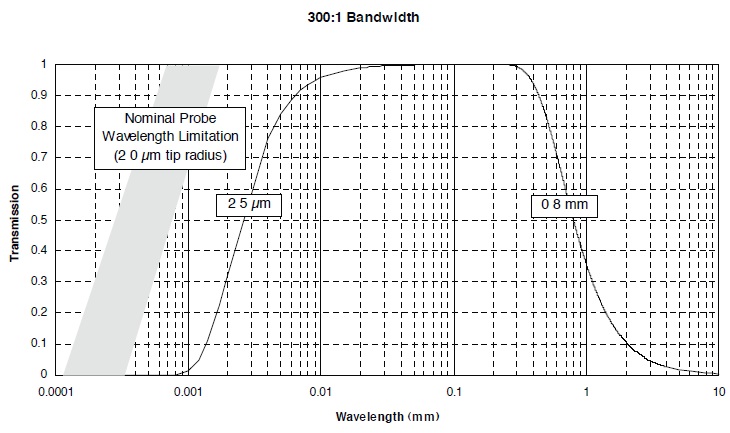 Figure 7. A typical roughness transmission characteristic for 0.8 mm roughness cutoff with a 300:1 transmission band.
The transmission characteristic of Figure 7 does indicate one significant factor: the stylus tip radius. The tip radius must be outside the desired transmission band for filtering to work properly. If the stylus is too large, the stylus itself provides the wavelength limitation, and this stylus-based transmission characteristic is not well-defined and not reproducible from instrument to instrument.
TLT: How can you choose the right filter?
Malburg: There are two things you need to choose:
1.
The filter type.
2.
The filter cutoff wavelength(s).
With regard to the filter type, there are three filters that are most useful today, as shown in Table 1.
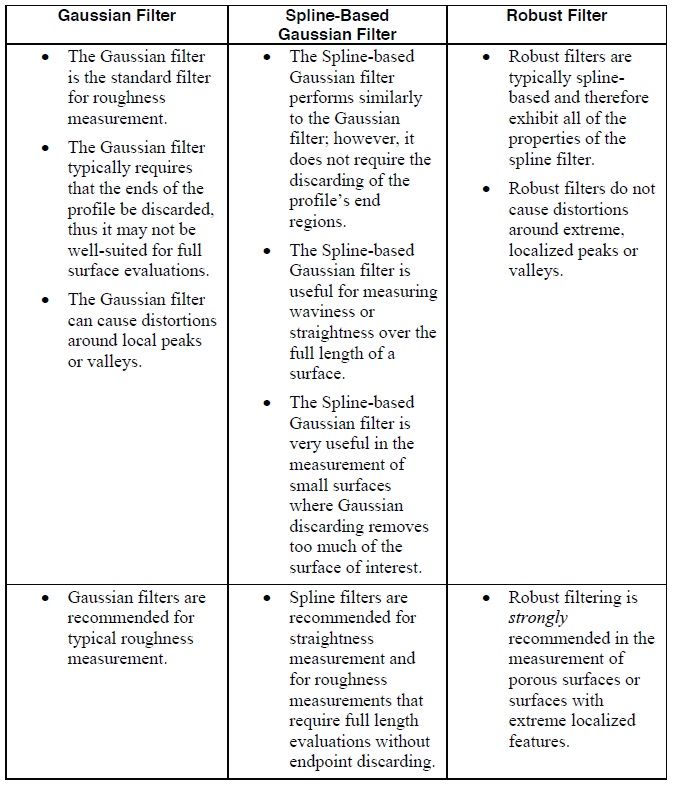 Table 1.
The ideal solution to selecting the right cutoff wavelength is determining the filter cutoff based on the wavelength regimes that are associated with the surface's intended function. However, this information is rarely available.
Following are three ways to determine a filter cutoff:
1.
Look at the way the waviness profile fits the measured data. Some software packages allow the waviness profile to be superimposed on the primary profile, as shown in Figure 8.
2.
Look at the profile's wavelength content graph and determine where there is a break in the wavelength domains. The wavelength content graph of the profile is provided in Figure 9.
3.
Choose the filter cutoff based on ISO/ASME recommendations. ISO 4288 (
2) and ASME B46.1 (
1) provide tables for choosing the filter cutoff based on the roughness of the surface. An example based on Ra is shown in Table 2.
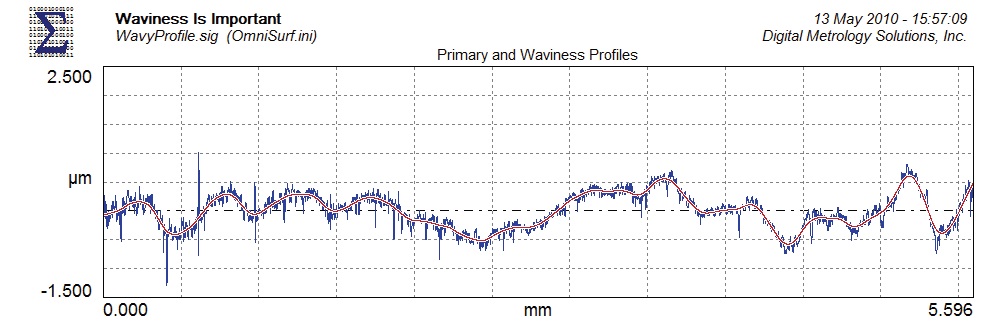 Figure 8. A waviness profile that fits the shapes.
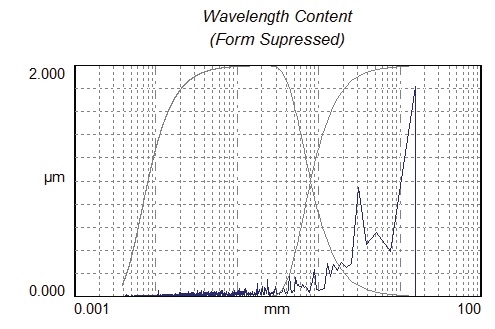 Figure 9. Using the wavelength content graph to determine filter cutoffs.
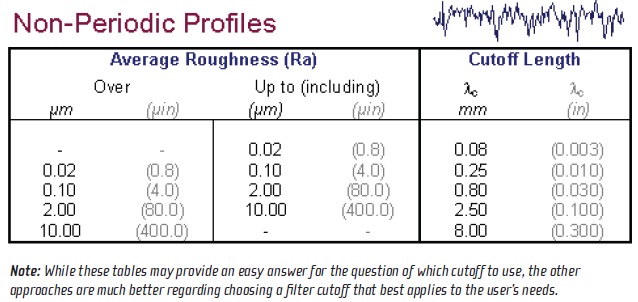
Table 2.
TLT: How can you put this on a drawing?
Malburg: ISO 1302-2002 (
3) provides a great toolbox for clearly designating the filtering conditions and tolerance limits for a surface. It provides fields for the wavelength regime and the filter type. Figure 10 gives an example of an ISO 1302-based specification with an upper limit (based on the leading U) on the parameter, Ra of 0.4 μm using a Robust filter with the wavelength transmission band of 2. 5 μm to 0.8 mm.
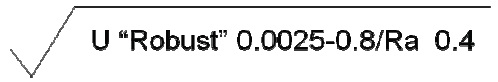 Figure 10. A roughness specification according to ISO 1302-2002.
TLT: Is there anything else new in terms of filtering?
Figure 10. A roughness specification according to ISO 1302-2002.
TLT: Is there anything else new in terms of filtering?
Malburg: The ISO TC213 Working Group 15 is developing a large set of technical specifications for various profile and areal filters, including Gaussian, Spline, Robust, Wavelet and Morphological filters. Recently, morphological filtering was used to solve some interesting waviness problems in sealing and stress concentration.
In sealing applications, a gasket or seal can conform to the surface to some extent. Given this property of the gasket, it doesn't make sense to look at the peak-to-valley height of the surface, as it makes more sense to look at the surface features that the gasket cannot fill. Using a morphological-closing filter (similar to rolling a ball over the waviness profile) we can derive a virtual gasket and calculate a parameter Wvoid, which reports the leakage area. The following surface profiles, as shown in Figure 11, have virtually the same Ra, Rz(DIN) and Wt, however, the morphological-based Wvoid parameter is nine times greater for the leaking profile.
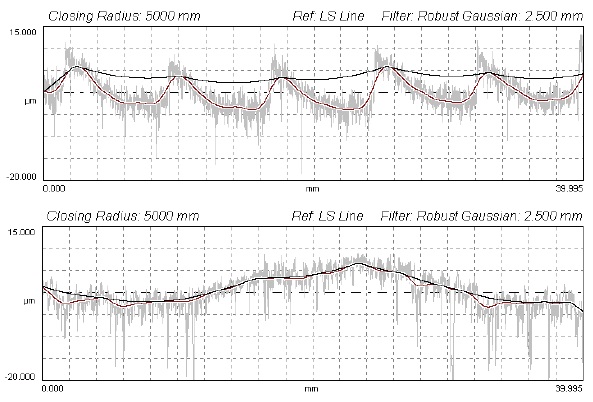 Figure 11. A virtual gasket applied to two profiles. The upper profile exhibits a Wvoid value that is nine times higher than the lower profile despite the fact that the profiles have similar Ra, Rz (DIN) and Wt values. (Source: click here)
Another very interesting application of morphological filtering is in the detection of local bumps or stress concentrations within a profile. In this case, a ball is rolled under the profile (which is a morphological-opening filter shown in Figure 12). Any local features that are sharper than the ball radius can be detected and reported. The parameter Wcvx (Waviness-convexity) is used to describe the highest bump relative to the morphological-opening filter.
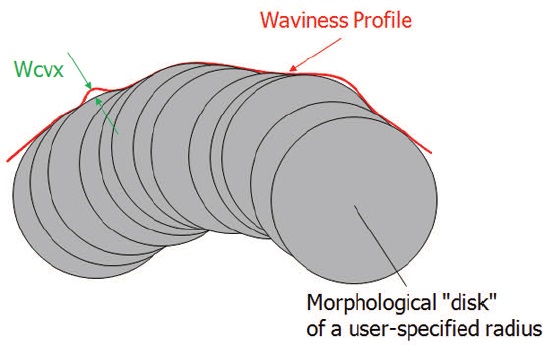 Figure 12. A morphological-opening filter for detecting local bumps.
TLT: Any closing remarks?
Figure 12. A morphological-opening filter for detecting local bumps.
TLT: Any closing remarks?
Malburg: Filtering is rapidly changing as new mathematical tools are being developed and new demands are placed on our measuring systems. From a user perspective, this can be overwhelming. However, there are still some basic principles that apply, including:
1.
In order to describe and understand surfaces, we must clearly define the wavelength regime that we are interested in, which is accomplished by filtering.
2.
If we do not define the wavelength regime of interest, our calculated results for roughness, waviness, contact stresses, lubrication and all other surface functionality are ambiguous and poorly reproducible.
In the most basic of terms, filtering is the first step toward understanding a surface. I personally would like to thank TLT for providing me with this opportunity and Dr. Valery Dunaevsky of Ingersoll Rand Climate Control Technologies for his contributions in helping with this article.
REFERENCES
1.
B46.1-2002 - "Surface Texture (Surface Roughness, Waviness, and Lay)," The American Society of Mechanical Engineers, New York, 2003.
2.
ISO 4288 - "Geometrical Product Specifications (GPS) - Surface Texture: Profile Method - Rules and Procedures for the Assessment of Surface Texture," International Organization for Standardization, Geneva, 1996.
3.
ISO 1302 - "Geometrical Product Specifications (GPS) - Indication of Surface Texture in Technical Product Documentation," International Organization for Standardization, Geneva, 2002.
You can reach Mark Malburg at mcmalburg@digitalmetrology.com.
For more information on filtering and surface texturing, visit www.digitalmetrology.com.
Several tutorials on these subjects are available, as well as free software for experimenting with surface texture analysis and filtering.