Strategic oil analysis: Instrument-based on-site lubricant analysis
Mike Johnson & Matt Spurlock | TLT Best Practices July 2010
Consider performing a detailed cost benefits analysis before determining what level of testing is right for your machinery.

KEY CONCEPTS
•
An on-site oil analysis plan requires careful planning and thorough consideration of the economic value.
•
On-site instrument technologies range from simple semimechanical devices to sophisticated software-driven electronic sensors.
•
Viscosity, moisture, solid particulate, wear debris and lubricant degradation all can be accurately measured with simple, effective, shop floor instruments.
Over the years, oil analysis testing has evolved into a major portion of a plant or facility reliability program. It also has become a mainstay in over-the-road (OTR) and construction equipment engine and systems monitoring. Often the practice has been to pull samples, affix appropriate labels, send off to a lab and wait for the test results to come back from the lab via mail, fax, e-mail, etc. Depending on shipping methods and laboratory distance, this process can take 5-10 business days from the time the sample is shipped.
There are a couple of options to shorten the time delay. One option includes overnighting all samples to the laboratory, which reduces the turnaround time at least 1-2 days. The other option, which is the focus of Part III of this five-part series, is to follow a hybrid approach to oil analysis and utilize one of the many on-site oil testing options.
On-site testing is not for everyone. While there is potential for considerable cost savings, there is also potential for considerable cost increases. A detailed cost benefits analysis should be performed to determine the required break-even sample volume, which will determine what level of on-site analysis is right for your plant.
A study conducted by STLE-member Ray Garvey of Emerson Process Management shows the following (
see Figure 1) as it relates to cost justification for on-site oil analysis (
1).
 Figure 1. Typical expected annual return-on-investment (ROI) for on-site or off-site lubricant analysis.
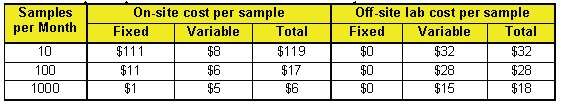
Figure 2. Typical cost per sample for on-site or off-site industrial oil analysis.
Figures 1 and 2 compare the costs, savings and expected ROI of on-site minilab oil analysis with off-site lab oil analysis. The assumptions behind these charts are:
1. Labor cost = $30/hr.
2. On-site fixed cost = $40,000 over three years.
3. Off-site analysis = $18 to $32 depending on number of samples.
4. Expected savings = $250,000 for typical industrial plant with full oil analysis (
2).
On-site oil sample testing ranges from simple, stand-alone manual viscosity tests to highly sophisticated, commercial-grade laboratory instruments at plant facilities.
This article:
•
Looks at key lubricant performance criteria to measure, including viscosity, contaminants, moisture, silt, solids and wear debris, oil chemistry, oxidation resistance, sludging and residue formation and chemical integrity.
•
Considers a multiparameter instrument approach.
•
Provides a general direction in selecting between onsite and off-site approaches.
VISCOSITY
Viscosity is the most important property of a lubricant, so it makes sense that some level of on-site viscosity testing be made available, if for no other reason than confirming incoming lubricants. The visgage is an ideal option for simply performing viscosity testing. With this viscosity comparator, the sample viscosity is compared with that of an oil with a known viscosity. An experienced user can achieve a near 95% accuracy rating with this instrument. The viscosity reading is made at room temperature to produce, without calculations, centistokes at 40 C or saybolt universal seconds (SUS) at 100 F.
There are multiple electronic viscometers available, ranging in price from a couple thousand to several thousand dollars that deliver quantitative results. All of these instruments’ purpose is to reveal to the measurement technician whether the viscosity is within 10% (first alarm) or 20% (second alarm) of its starting point.
GENERAL REFERENCES FOR INSTRUMENT SUPPLIERS
Louis C. Eitzen Co. Inc. (
www.visgage.com)
Hy-Pro Filtration (
www.hyprofiltration.com)
CCECO Lab and Filtration (
www.cceco.net)
Fluitec (
www.fluitec.com)
Spectro Inc. (
www.spectroinc.com)
On-Site Analysis Inc. (
www.on-siteanalysis.com)
Emerson Process Management [Formerly Computational Systems, Inc.] (
www.emersonprocess.com)
Koehler Instruments (
www.koehlerinstrument.com)
WATER CONTAMINATION
Unfortunately, water is a debilitating contaminant that is present in many production environments. Water enters systems from many different sources, including:
•
Operator washdown activities
•
Rain, snow, runoff
•
High atmospheric humidity/supersaturated production areas
•
Long-term sump condensate buildup
•
From lubricant stores, packaging containers, product handling methods.
It is important to identify even small amounts of water during ongoing production activities. The least expensive and most easily conducted test is called the crackle or hot plate test. The crackle test, while somewhat quantifiable, is a go/no go test for industrial lubricants. To perform the crackle test, the analyst selects a well-ventilated area and prepares a very hot surface. A laboratory hot plate heated to 300 F-plus, or a small metal pan (skillet) over a sterno or gas burner (or in a pinch, a spoon and a lighter) will work. Next, the technician places one or two droplets of used oil onto the surface. Exercising care to avoid inhaling vapors, the technician looks for bubble formation and listens for crackling from the oil. Any sign of bubbles is a strong indicator of water contamination. If there are large bubbles accompanied by a crackling sound, similar to bacon on a frying pan, there could be 1,000 ppm-plus of water contamination in the sample.
If water is identified in the sample through an on-site crackle test, different levels of maintenance action should be considered depending on the level of water found and the sensitivity of the machine components to water contamination, starting with confirming the presence and concentration of moisture. A second sample is collected and dispatched for lab analysis for long-term trending purposes. The sump should be either drained and flushed (for small sump sizes) or dehydrated with one of several available types of moisture-removal systems. There is no advantage to waiting for sample results to return to take action. For samples where the water contamination appears to be in question, or very low, the technician should draw a new sample for dispatch to quantify the water concentration. In marginal contamination scenarios, lab analysis can help determine the most appropriate action.
SOLID CONTAMINATION AND WEAR DEBRIS
The patch test can provide a sophisticated view into a couple of important aspects of solid contamination in the sump. When this test is performed in a commercial lab environment, a highly skilled and experienced analyst reviews the patch particles under a microscope and renders a verdict for either wear debris origin or status of particulate concentration. Using materials from a kit, like the one shown in Figure 3, the patch test performed on the plant site provides the same function.
 Figure 3. Prepackaged patch kit for ferrous and contaminant monitoring.
In this test, a 100-ml sample of oil is drawn through a predetermined-sized filter patch (typically 0.8 to 1 micron media) and then washed with prefiltered mineral spirits and set on a clean, low-draft surface to dry. The patch, as shown in Figure 4, is then viewed under a microscope, and the captured particles, particularly the identifiable metals, are observed for identification. If the metals concentration is very low but noticeable, and the analyst wants to see more for the sake of accuracy, the test may be repeated with a liter or more of oil through the patch in order to capture a greater cross-section of metals.
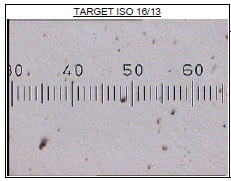 Figure 4. Typical patch result viewed through a microscope.
A commercial laboratory will use a metallurgical microscope capable of various lighting methods and magnification to 1,000 times or more. The cost of these types of microscopes can exceed $15,000. For on-site purposes, a microscope capable of simply supplying a light source for adequate particle identification at 200 times magnification would be appropriate. Even at this level, the user would be able to identify conditions that would warrant additional testing.
Next, for fluid cleanliness measurement, the patch is placed beside a color standard and compared to known hues of gray or brown in order to obtain a grade. The grade fits within one or two ISO codes, and the cleaner the oil the more dependable the estimate. Experience suggests that machine operators can, for a few cents, conduct cleanliness testing on the site floor and get instant results that will enable them to accurately guess the ISO grade (not particulate distribution) and, more important, give them very specific direction for action (
3). This approach was developed in the 1970s and has been widely used to deliver accurate, immediate input for fluid maintenance decisions.
OIL HEALTH
There are multiple instruments with which to monitor oil health. Some provide only pass/fail level identification while others provide detailed input into the nature of observed changes. Pass/fail level analysis may be adequate for low-criticality, low-sump volume machines. Strategically one could argue that there isn’t much reason to perform condition monitoring on machines of this nature short of avoiding an oil change. Often sumps in this category will benefit from the change as much for contamination control as oil health improvement. Assuming that the low-criticality sump should receive this treatment anyway, there is reason to focus greater attention on the critical sump, for which we will seek a greater detail of information and knowledge about the machine’s operating state.
Linear Sweep Cyclic Voltammetry (RULER™). RULER stands for Routine Useful Life Evaluation Routine by Linear Sweep Voltammetry (LSV). It is described by ASTM 6971 as a means to measure the remaining useful antioxidants in lubricants.
Utilizing voltammetric techniques, the RULER, as shown in Figure 5, quantitatively analyzes the relative concentrations of antioxidants in new and used oils in order to monitor the depletion rates of the antioxidant protection package in the oil and, consequently, the lubricants’ remaining vitality. The RULER can be used proactively to determine proper oil change intervals or extend intervals through timely sweetening of the fluid to replenish antioxidant levels.
 Figure 5. The RULER instrument for antioxidant measurement (Courtesy of Fluitec).
Additionally, the RULER can be used to quantify antioxidant levels of incoming and stored oil supplies and to detect abnormal operating conditions, prior to equipment failure signaled by abrupt antioxidant depletion rates (
4).
Blotter test. The purpose of this test is to determine insoluble contaminants and dispersive ability. The test is performed by applying a prepared drop of used oil onto the center of a permeable paper circle. The test is timed to allow it to disperse and set. The development and nature of the resulting halos, or rings, is then evaluated for total contaminants and lubricant dispersive effectiveness. In Part II we discussed the test in greater detail dealing with sensory inspections.
On-site infrared analysis. Significant advances in the realm of infrared (IR) analysis have expanded the role of IR for on-site test equipment. There are several indicators of IR analysis that should be considered, including:
•
Acid number
•
Base number
•
Oxidation
•
Nitration
•
Sulfation
•
Additive depletion
•
Incorrect lubricant
•
Water
•
Gylcol
•
Soot.
Each of these properties is important to a comprehensive reliability program or when the objective is only to optimize lubricant change intervals. The FluidScan instrument developed by Spectro, Inc., as shown in Figure 6, offers this capability. This instrument uses a comparison between the in-service and a baseline of the oil that is stored in the instrument. The instrument identifies differences and provides specific input as to the nature of the lubricant change and/or failure within seconds.
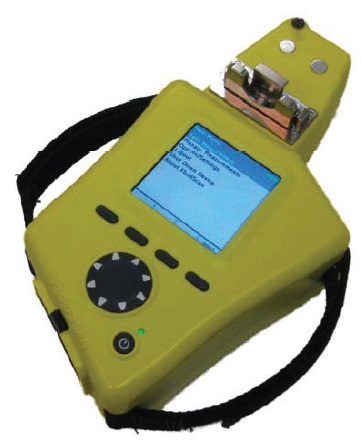 Figure 6. The FluidScan Handheld IR Analyzer (Courtesy of Spectro, Inc.)
With the instruments noted above, the reliability manager can make decisions regarding the state of lubricant health and effectiveness covering a broad array of concerns. The key benefits to assembling instruments from multiple vendors are timing and selectivity. A programmatic approach can be slowly assembled, and particular needs can be addressed by individual instrument strength. The aggregate cost of assembling the entire set of instruments likely will be higher in the long run than the cost of purchasing an instrument suite.
ALL-IN-ONE TESTING
All the tests mentioned so far will yield very good results once experience and confidence is gained. There are also comprehensive systems that are available, albeit at a higher initial purchase cost. These include the all-in-one, minilab or lab-in-a-box type of analyzers. The significance of these is that they measure several parameters of a lubricant allowing for further depth in analysis, beginning with Sample One.
The CSI 5200 Minilab, as shown in Figure 7, is a desktop-sized instrument that has the ability to measure several lubricant parameters, including:
•
Delectric constant
•
Chemical index value
•
Ferrous index value
•
ISO cleanliness code
•
Calculated kinematic viscosity derived from absolute viscosity at room temperature
•
Micropatch preparation for wear debris analysis through microscopy (microscope required).
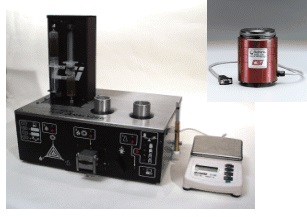 Figure 7. The CSI Lubricant Analysis Minilab (Courtesy of Emerson Process Management)
The 5200 is tuned toward the needs of rotating machinery owners, where the fundamental failure modes for lubricated components are predominantly two- and three-body abrasive wear.
The On-site Analyzer, as shown in Figure 8, is a large Desktop-sized instrument that also measures a wide array of parameters. It contains components with the ability to identify the presence of 20 metals and measure physical properties such as glycol, TBN, soot (diesel engines only), fuel dilution, water, nitration and oxidation. Additionally, the build-in dual temperature measures viscosity at 40 C and 100 C. It also has an integrated particle counter. Once the analysis is completed, the instrument provides a diagnostic report that includes suggested preventative maintenance steps based on internal historically derived information. The on-site analysis is tuned toward the needs of fleet owners, where the focal point is engine oil analysis, and the failure modes reflect a high incidence of corrosive and chemical wear.
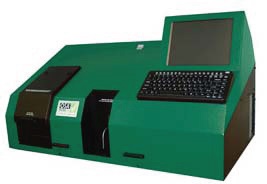 Figure 8. On-site Oil Analyzer (Courtesy of On-Site Analysis, Inc.)
SELECTION STRATEGY FOR OSA
As is the case with most condition-assessment purchase decisions, this choice is a matter of value contribution to the production cycle. The value, in this instance, is time required to make accurate decisions to support the reliability plan. The key constraint is the potential for rate of lubricant change. Decision timing becomes more significant as the production environment aggressiveness increases.
Clean environments, such as that found in electronics manufacturing and assembly sites, are much less prone to degrade lubricant condition than harsh environments. Harsh dry environments degrade lubricants more slowly than harsh wet or harsh chemical-laden environments. Cement manufacturing operations are hot and particularly heavy laden with highly abrasive solid particles, and the rate of change for the lubricant in the machine environment is high. The rate of particulate level change is extremely high.
If a cement manufacturer intends to maintain strict control on contaminant levels in the sumps, then on-site particle counting would be appropriate vs. lab-based results. The cost per particle count and the time value for rendering a decision is low. On the other hand, the potential for lubricant viscosity change is slow. Maintenance of proper viscosity is also essential, but since the risk of significant change in viscosity is low, the site can afford to allow for more time between viscosity tests and more time to receive the test results.
Food processing plants have low hard-particulate loads but often have extremely aggravating water and chemical contamination conditions. Sites that exercise daily washdown actions with high-pressure hot water and caustic tend to routinely inject wash chemicals into sumps. Since the wash chemicals are designed to break the lubricant, the potential for the rate of change is extremely high, which makes information pertaining to lubricant chemical degradation highly useful. In these instances, the value of on-site screening is high and allows for sumps to be managed in a timely manner.
Manufacturers should consider on-site screens and offsite trigger-based lab analysis for the following conditions:
•
The site expects to conduct more than 300 samples per month on an ongoing basis.
•
The site exercises daily to weekly washdown activities of critical production trains.
•
The rate of change from heat, water or chemical degradation is high for critical machines.
•
Specific production machines have exceedingly tight alarm limits for parameters subject to rapid change (moisture, solid contaminant, chemical contamination).
•
Cost-effective and timely lab response is not available (such as in developing industrial nations).
SUMMARY
On-site lubricant analysis is a viable option for many plant environments. Evaluation of the economic potential and timeliness for making reliability improvement decisions should be afforded a good deal of consideration before moving forward with this strategy.
There are multiple individual instruments that are useful to providing discrete pieces of information. There are also instrument suites that provide the means for several measurements, including integrating results into a report. Time should be allowed for both instrument and topical training as part of the decision.
Production processes that produce highly aggressive environments will derive added benefit from both quality and timeliness of rendered information for sump management.
REFERENCES
1.
Garvey, R., “Case Histories and Cost Savings Using In-Shop Oil Analysis,” CSI Industry Report.
2.
Ibid, i.
3.
Millipore Test Patch Kit: click
here. Millipore Patch Kit XX6504730.
4.
Click here.
 Mike Johnson, CLS, CMRP, MLT, is the principal consultant for Advanced Machine Reliability Resources, in Franklin, Tenn. You can reach him at mike.johnson@precisionlubrication.com
.
 Matt Spurlock, CMRP, MLA II, MLT I, LLA I, is the machine lubricant subject matter expert at Allied Reliability, Inc., in Indianapolis, Ind. You reach him at spurlockm@alliedreliability.com
.