Interpreting oil analysis data
Jack Poley | TLT On Condition Monitoring November 2009
Be as thorough as possible, use a logical process and provide a conclusion with a high level of efficacy.
In September we introduced the notion of spherical evaluation techniques, i.e., approaching the oil analysis evaluation problem from all directions and nuances possible like, for example, a puzzle.
We started with a significantly out-of-spec viscosity difference in a gearbox with a straight-grade oil, almost always indicative of a mis-add such as putting the wrong product in the gearbox sump.
Later we presented the same problem with a diesel engine, wherein viscosity decreased substantially, though we now had to also consider an operating problem, possibly in the fuel-delivery circuit. As a result, this added another layer of thought, which is still a rather simple diagnostic consideration. The report herein adds yet more complexity to the evaluation process. Note: The data flagged here were flagged against statistical determinants for similar components and applications.
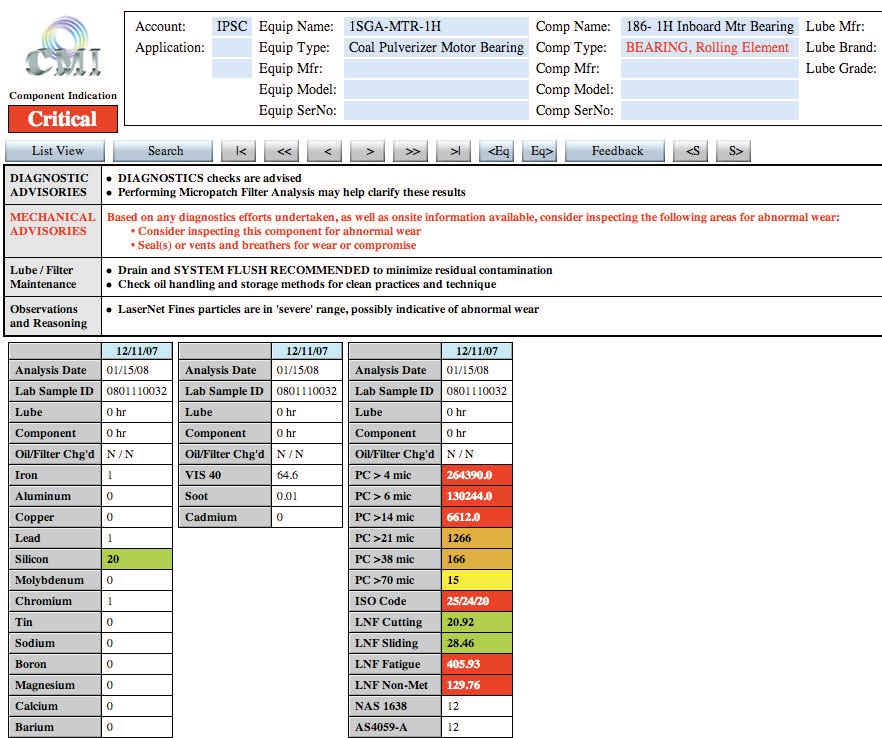
The report already has been evaluated, but here are prima facie facts:
•
The severe (red) particle count (PC) values are concentrated in the smaller size range.
•
LaserNetFines (LNF) results are a product of particle sizes greater than 20 microns (with an upper limit of approximately 200 microns).
•
Silicon is flagged at a notable level (green).
•
Other values are abnormal (yellow) and high (orange).
•
All wear metals from spectrometric analysis are essentially nil.
Following are some questions one might ask:
PC RESULTS:
Since small particles are predominant, some surely within the detection range of the UV spectrometer, why are there essentially no metals concentrations despite the high PC?
Answer: The particles are non-metallic.
If the particles are non-metallic are they abrasive?
Answer: Maybe some are, but there’s not enough silicon (even if it is abrasive) to support such a high PC.
Then what’s left to consider as a contaminant?
Answer: How about coal dust that entered via a compromised seal of a non-metallic and non-silicon nature? Or careless handling of the oil during a top off? Or careless storage practices for this oil’s source drum?
Why did you speculate coal when we have no coal test?
Answer: Because I observed the equipment type in the report header, and I’ve nothing better to offer at present (yet).
Why isn’t the coal abrasive?
Answer: Not sure, but it doesn’t have to be abrasive if the particle sizes are sufficiently small enough for this bearing’s clearances.
LNF RESULTS:
What does the fatigue category and value signify?
Answer: Metallic particles greater than 20 microns and, therefore, not detectable via testing on a UV spectrometer.
What does the non-met category and value signify?
Answer: Could be coal particles but could also be seal material (non-silicon based).
SILICON VALUE:
What is to be made of this value?
Answer: Not much. It is only notable and seems somewhat incidental compared to the PC and LNF values. On a relative basis, it is not a player here.
EVALUATION:
So the red values are the drivers for the assessment?
Answer: Yes, usually the highest data severities tend to become the driver.
And the other colored results are supporting and clarifying?
Answer: At times. The PC profile suggests the smaller sizes are the main focus, though the entire range is of interest. The two green LNF values are irrelevant.
So the commentary sequence is a rendered narrative of the logical and defensible speculation we’ve just performed?
Answer: Yes.
That’s a lot of speculation for a single sample and no history.
Answer: Yes, but there is a flow of logic—and a micropatch analysis has been suggested for clarification prior to making a decision to physically inspect the bearing.
SUMMARY
The commentary furnished is one person’s opinion, but it is supported by data and a reasoning process that, while perhaps off target or partially so, is certainly a credible possibility. All the data were considered in the context of the component and, equally important, its application and environment. Other supportable possibilities are always acceptable.
The trick is to be as thorough as possible and provide a conclusion with high efficacy. Ultimately, feedback, what is actually found and what actually occurred, will vet the evaluation. This, in turn, will govern one’s thinking for the next time a similar data pattern exists for this component.
 Jack Poley is managing partner of Condition Monitoring International (CMI), Miami, consultants in fluid analysis. You can reach him at jpoley@conditionmonitoringintl.com
.
For more information about CMI, visit www.conditionmonitoringintl.com.