21st Century oil analysis
Jack Poley | TLT On Condition Monitoring March 2009
Following 60 years of innovation, fluid specialists today have an arsenal of powerful oil analysis tools.
Oil Analysis has seen considerable changes—make that advancements—in just the last few years, thanks to technological breakthroughs spurred by increased demand. Online sensors are probably the most notable example and are beginning to assume their rightful place in the condition monitoring arena, but there are other technologies in play, as well.
The LaserNetFines (LNF) (see Figure 1), a multitasking particle counter, was developed for military requirements. As well, continuing demand from maintenance managers and mechanics in the private sector for on-site testing led to several innovative instruments debuting in 2008. Among the most promising are a portable magnetometer that measures ppm iron (see Figure 2) and a handheld device for infrared spectroscopy (see Figure 3), spurred by the need to have critical information about a machine as fast as possible.
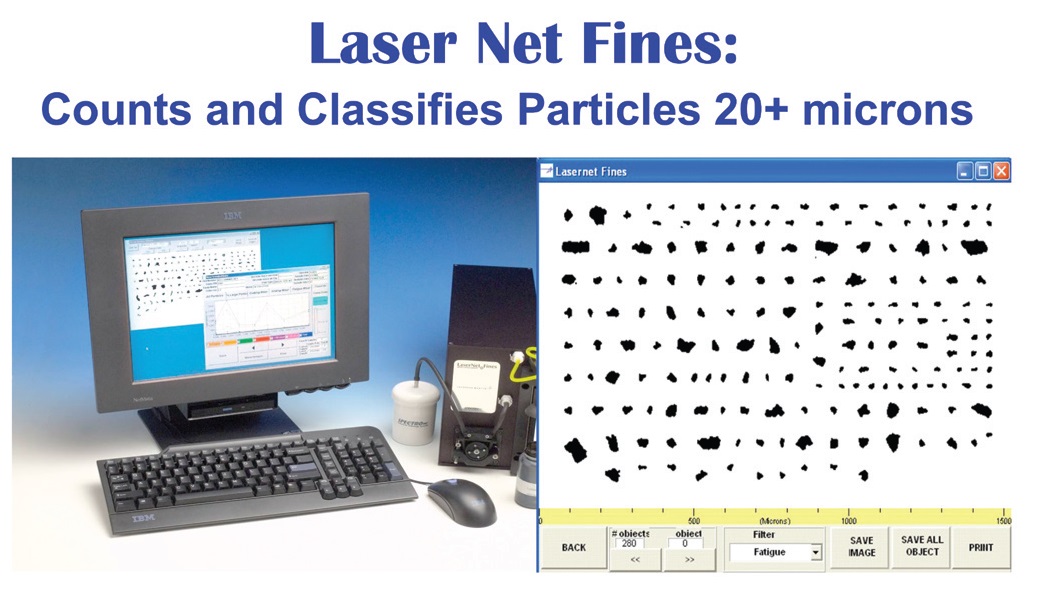
Figure 1. A particle counter with many other facets. (Courtesy of Spectro, Inc.)
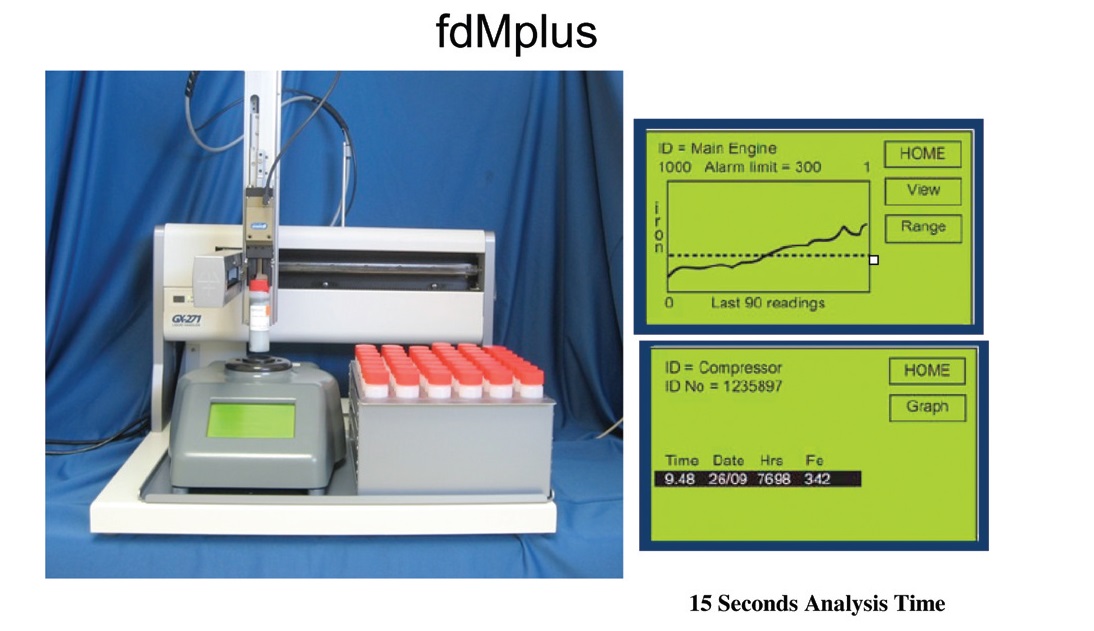
Figure 2. Introduced in 2008, this is the first of expected “on-site” instruments designed to shorten the time to gain quantitative information on important (BIG 4) wear metals, iron being the most important, most of the time. (Courtesy of Kittiwake Developments, Ltd.)
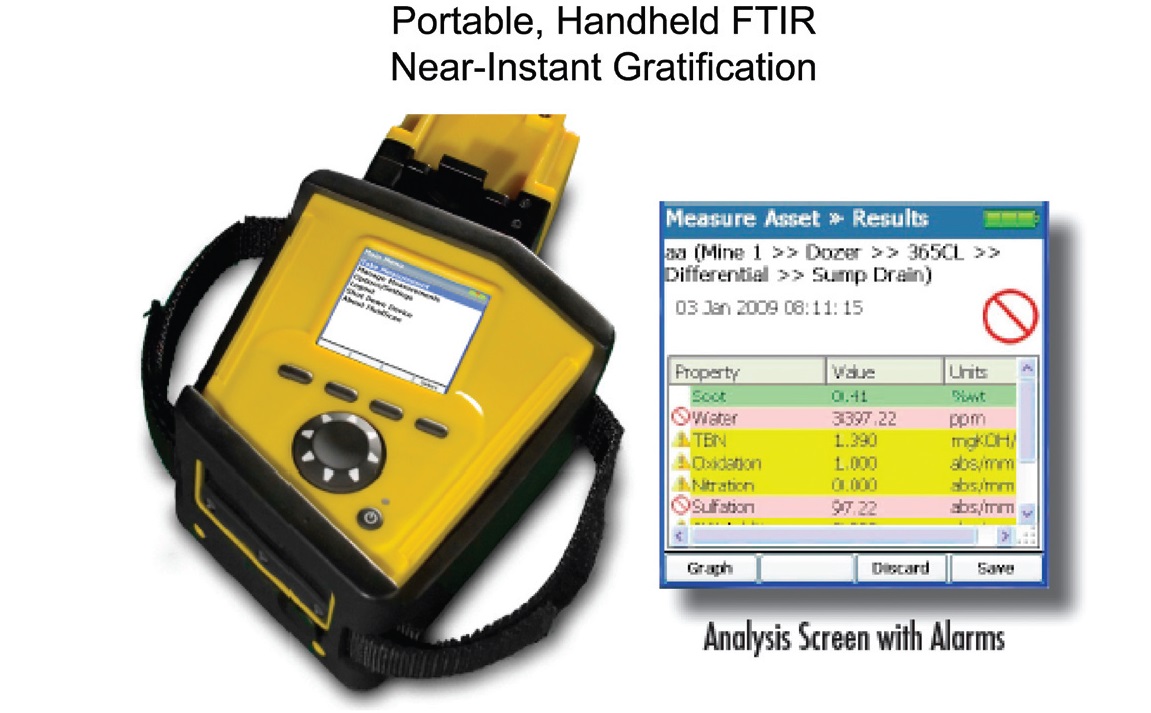
Figure 3. Battery-operated handheld device for on-site FTIR analysis, including alarm sets. (Courtesy of Spectro, Inc.)
Let’s review the history of oil analysis with respect to innovation.
1940s, 1950s & 1960s
In 1948 Denver & Rio Grande Railroad spurred its industry to utilize UV spectrometers to test used oils for principal wear metals: iron, copper, aluminum and lead (I call these the Big 4), followed by other metals to help diagnose problems, e.g., chromium, nickel, sodium, etc.
In the late 1950s Walter Baird successfully semiautomated the UV spectrometer for metals, and the technique was applied to oil analysis.
Around 1960, 12 years after the railroad oil analysis movement, the throughput and cost/sample achieved favorable levels, and commercial oil analysis was born. The U.S. Navy quickly followed suit.
Two seminal developments are worth mentioning. First, railroads were bold in pioneering wear metals detection, which launched modern oil analysis. Focusing on the mechanical health of the machine, rather than the oil’s quality and suitability for further use, was the objective.
The second seminal development was semi-automating the UV emission spectrometer. This ushered in the commercial oil analysis industry.
1970s AND 1980s
Infrared spectrometric analysis and particle counting began plugging data and information gaps in the UV spectrometer analysis, although that instrument still remains the core test of most oil analysis programs and rightly so.
Ferrography also was invented in this period and is arguably the most effective decision-making tool in oil analysis, particularly when contemplating a mechanical inspection. Ferrography clarified the need to understand the nature of particles more specifically, particularly their morphology.
Seminal developments:
• Ferrography (Vernon Wescott et al.).
• Infrared spectrometers equipped with computers performing Fast Fourier Transforms (FFTIR). This allowed rapid calculations on complex spectra to provide timely quantitative data on important aspects of lubricants such as oxidation and fuel soot (diesel engines).
1990s
This was a decade of consolidation and technology improvement featuring lowered costs for most instruments or more technology for the same cost. Particle imaging software began to surface, enabling pattern recognition development for specific types of wear and other trauma.
XRF (x-ray fluorescence) began seeing usage in used oil analysis venues in addition to its usual application as an additive package monitor for lube blenders. Today it is commonly employed for particle composition inspections such as filter debris. A micropatch analysis followed by XRF elemental analysis has much merit.
CCDs (charge-coupled devices) were introduced as detectors and were applied to a number of technologies, including cameras. The UV spectrometer also was fitted with CCDs, replacing costly photomultiplier tubes.
2000 TO PRESENT
The LaserNetFines is perhaps the most innovative laboratory instrument for oil analysis in the first decade of the 21st Century. Around 2005 on-line and on-site testing received increased attention.
On-line, of course, refers to sensors and their rise to acceptance in significant fashion. This came about because robust, properly performing products were finally available. The technology in sensor development is advancing at a furious pace, and while this has enhanced the efficacy of sensors it also has spilled into the portable instrument testing field.
At least two fresh and remarkable products were introduced in 2008: a bench-top, quantitative iron analyzer and a handheld infrared device. The 21st Century, therefore, has already seen four seminal developments:
• LaserNetFines (LNF), a particle counter with the ability to classify particle shape at 20 microns and greater. Additionally a number of parameters, normally determined via infrared analysis, are available.
• Dependable sensors mounted in the oil circuit.
• On-site ppm iron within 15 seconds. Having quantifiable iron concentration available on-site, especially if one is on an offshore drilling platform, is a huge advantage.
• Portable, handheld infrared analysis.
SUMMARY
Today oil analysis is entering a new set of paradigms:
1. Real-time, not episodic, on-line oil analysis. Online, real-time analysis via sensors is a no-brainer for machines in remote installations such as offshore drilling platforms or wind turbines. Coupled with effective portable testing equipment, such as the two new entries in 2008, many problems and potential problems can be detected and identified in minutes instead of days.
2. Three distinct tiers to oil analysis now exist:
a. On-line: Sensors
b. On-site: Sophisticated field kits and now instruments.
c. Off-site: To fill information voids and validate decisions.
3. The synergy of oil analysis and other NDT is at hand. Oil analysis is usually conceded to be the most revealing form of NDT (non-destructive testing). Now that oil analysis has finally “caught” vibration analysis as a real-time monitoring tool, the two principal forms of NDT now can literally work together, employing other techniques for clarification as needed.
Oil sampling is probably at an all-time high now. There’s no reason why it won’t continue to grow and maintain its position as king of NDT testing, as advances of the types described above continue to make it easier, more revealing and more cost-effective than ever to have a powerful oil analysis program in the maintenance toolkit.

Jack Poley is managing partner of Condition Monitoring International (CMI), Miami, consultants in fluid analysis. You can reach him at jpoley@conditionmonitoringintl.com. For more information about CMI, visit www.conditionmonitoringintl.com.