The Viscosity at the Glass Transition of a Liquid Lubricant

Scott Bair

Regents’ Researcher

Georgia Institute of Technology, Center for High-Pressure Rheology

INTRODUCTION: The glass transition in elastohydrodynamic lubrication (EHL) liquids under pressure has been the subject of discussion and speculation for more than forty years.  The glass transition has not been a recent topic of classical EHL as the viscosity there is described by simple pressure relations based on fictional accounts of viscometer measurements in which the viscosity does not usually reach to the large values for which the transition occurs. With the recent move towards quantitative EHL which employs real thermophysical properties, the glass transition in EHL liquids should be reexamined.

The limiting low shear viscosity at the glass transition is most often given by a “rule-of-thumb” as 1012 Pa·s which seems to be more appropriate for molten minerals than organic liquids.  Experimental measurements of the glass transition and the viscosity of liquid lubricants over a range of temperature and pressure more than thirty years ago [1] indicated that the glass viscosity must be much smaller, 107 to 109 Pa·s. Schweyer [2] found  =108 Pa·s for asphalts under pressure.  Measurements at ambient pressure of viscosity up to 3.7×10⁸ Pa·s from the University of Chicago [3] compared with glass transition measurements by transient hot-wire at Umea University [4] give the viscosity at the transition to be  =1.23×10⁷ Pa·s for squalane when the observation time is 0.3 seconds.


EXPERIMENTS: The liquid lubricant is MCS 460, a cycloaliphatic synthetic hydrocarbon produced by Monsanto.  The relative volumes in isobaric cooling and isothermal compression experiments are plotted in Figure 1 left.  These measurements were performed in dilatometers. For characterization of the temperature and pressure of the glass transition, it is not necessary to precisely determine volumes (or densities), only the relative changes in volume. The curve in Figure 1 right fitted to these data represents the Oels and Rehage [5] equation

(Tg(p)=tg0+A1ln(1+A2p)


Figure 1. Left, the glass transition detected in isothermal compression at 322K.  The arrow indicates the time sequence in which the measurements were made.  Right, the glass transition temperature as a function of pressure and the correlation of Oels and Rehage.


Falling cylinder viscometers were used to generate viscosity data. Extrapolations of viscosity to the glass transition may be bedeviled by a dynamic crossover as shown in Figure 2 for the pressure dependence of the viscosity at 313 K. The Vogel, Tammann and Fulcher (VTF) equation represents the temperature dependence


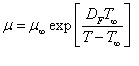
And the Johari and Whalley equation represents the pressure dependence.


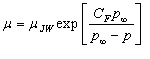
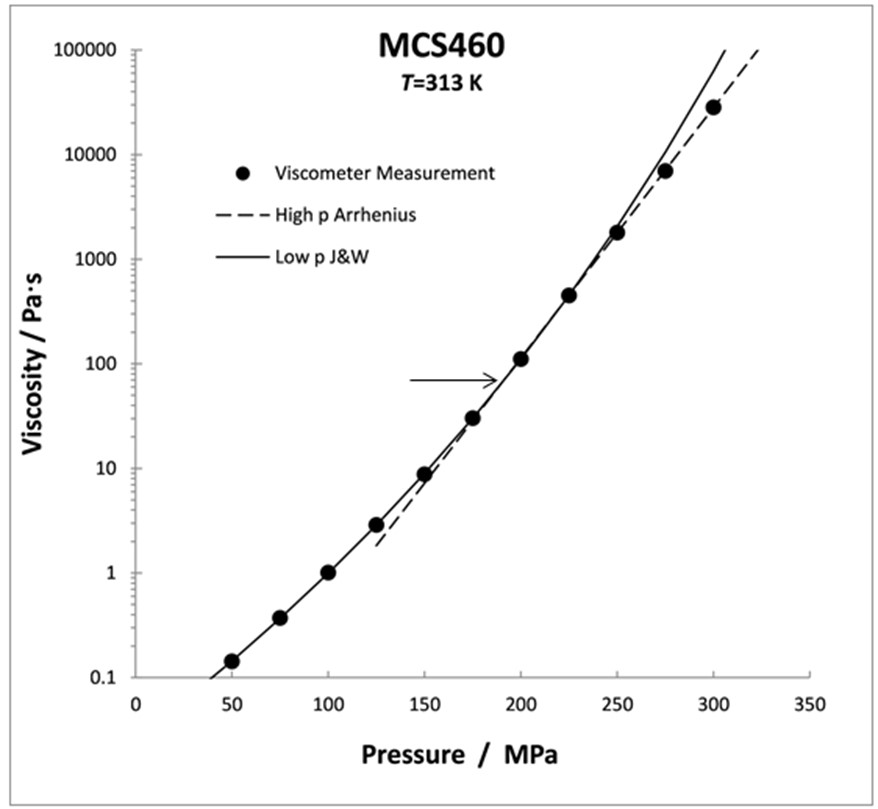
Figure 2. The pressure dependence at 313 K showing a crossover (at the horizontal arrow) which can be best represented by two J&W equations.


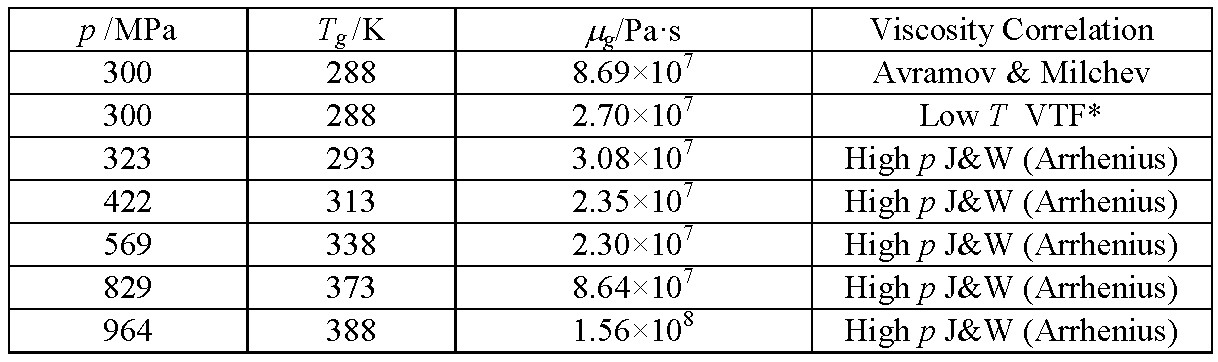
DISCUSSION: With the recent trend toward the use of real viscosity in analyses, the possibility of a glass transition in the lubricant film cannot be overlooked.  This event is more likely for the liquids designed for high friction, traction fluids, which are also susceptible to a dynamic crossover.  The glass transition is a phenomenon occurring at a specific value of viscosity for a given liquid.  It seems well-established that for the much studied inorganic liquids (mineral melts) the glass transition viscosity is of the order of 1012 Pa·s.  However, the situation for organic liquids is less clear.  Here, for one liquid lubricant, the glass transition by dilatometry combined with falling cylinder viscometry places the viscosity at the transition at between 107 and 108 Pa∙s, in the same range as squalane.


 REFERENCES:

1. Yasutomi, S., Bair, S., & Winer, W. O. (1984). An application of a free volume model to lubricant rheology I—dependence of viscosity on temperature and pressure. Journal of tribology, 106(2), 291-302.

2. Schweyer, H. E. (1974). Glass transition of asphalts under pressure. Journal of Testing and Evaluation, 2(1), 50-56.

3. Deegan, R. D., Leheny, R. L., Menon, N., Nagel, S. R., & Venerus, D. C. (1999). Dynamic shear modulus of tricresyl phosphate and squalane. The Journal of Physical Chemistry B, 103(20), 4066-4070.

4. Bair, S. S., Andersson, O., Qureshi, F. S., & Schirru, M. M. (2017). New EHL Modeling Data for the Reference Liquids Squalane and Squalane plus Polyisoprene. Tribology Transactions, DOI: 10.1080/10402004.2017.1310339.

5. Oels, H. J., & Rehage, G. (1977). Pressure-Volume-Temperature Measurements on Atactic Polystyrene. A Thermodynamic View. Macromolecules, 10(5), 1036-1043.