INTRODUCTION: Driving on ice is a delicate exercise due to the poor adherence of tire on ice and the use of studded tires is tightly regulated or forbidden in many countries. In this context of road safety improvement under severe climatic conditions, it is necessary to precisely study and investigate the sliding contact between rubber and ice and to determine the different key mechanisms governing the tribological behavior of the rubber-ice contact.
The strategy chosen in this work is to investigate the rubber-ice contact at different scales – macrometric (scale of apparent surface contact), micrometric (scale of group of contact between asperities) and nanometric (scale of a contact spot) – in order to link the physical process of friction and adhesion observed at the macrometric scale to their potential causes induced at subscale (micrometric and/or nanometric). In this presentation, mechanisms at the micrometric scale will be focused on.
METHODS: The KŌRI tribometer1, developed in LTDS, was used to perform ice/rubber friction experiments. The contact consists in a rubber spherical sample vs a transparent ice disc. The contact kinematics was controlled, with each solid velocity ranging from 50 mm/s to 1 m/s, the contact forces were measured up to 20 daN and the contact was simultaneously visualized by means of a camera with a resolution of 5x5 mm2. A cooling system was designed in order to maintain the contact zone at a negative temperature, down to -20°C, for several hours, independently of the external temperature and humidity conditions.
In parallel, an ice manufacturing unit was designed to produce a repeatable transparent vertically grown ice disc.
Rubber/ice friction experiments were performed with an immobile rubber and a sliding ice disc for several sliding velocities, under an initial loading of 10N, during steps of 30s. Each measurement was repeated three times for each sliding velocity.
RESULTS and DISCUSSION: The rubber/ice static contact in Figure 1 illustrates the capability of visualization. After adequate image treatment, it is possible to identify the spots in contact and the apparent contact area.
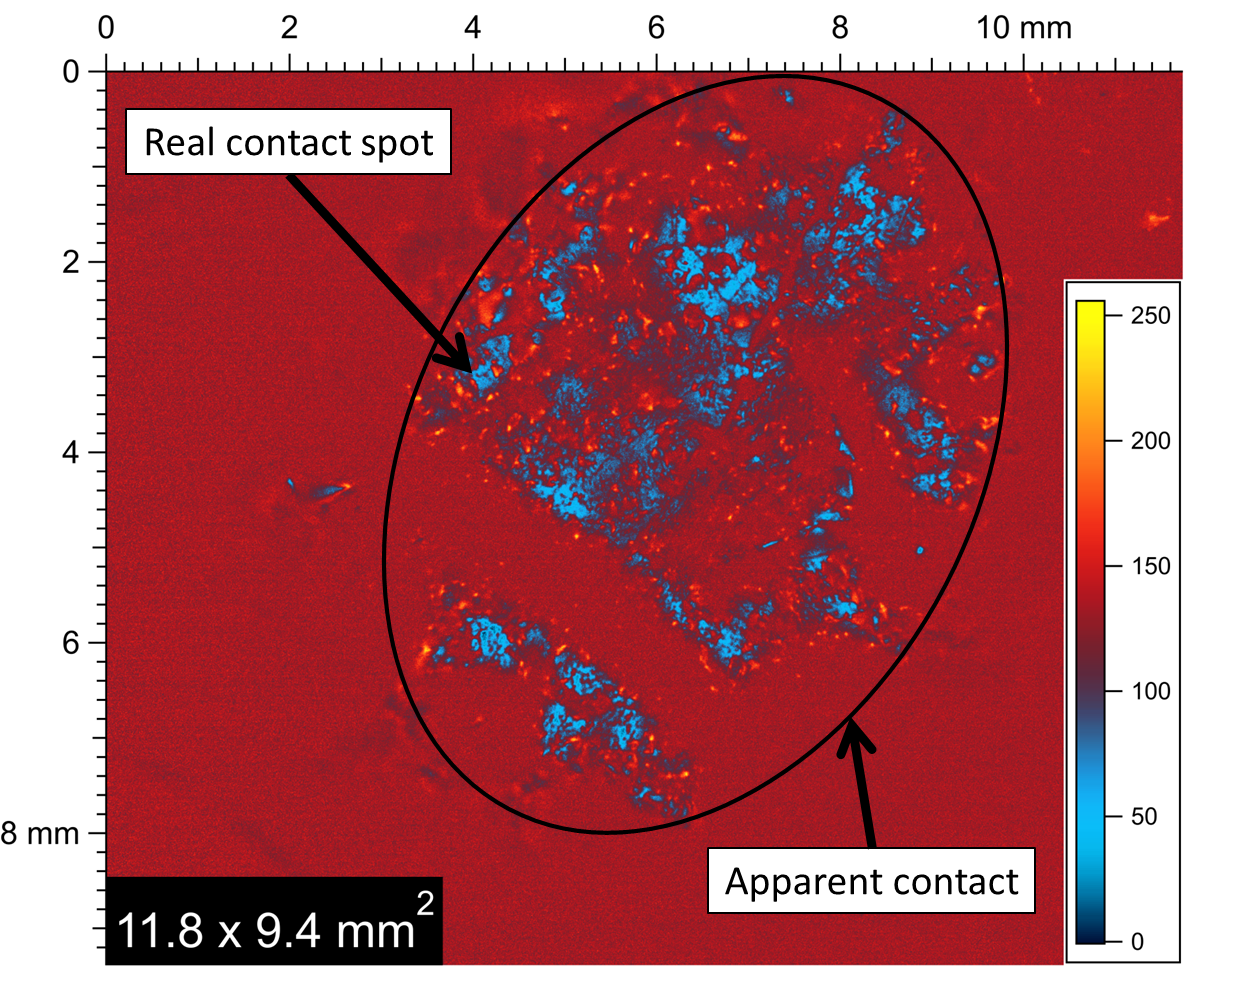
Figure 1 – Example of a static ice/rubber contact showing in blue the spots of contact and in red the no-contact zone. The ellipse in black line represents the apparent contact area.